- Hong Kong
- /
- Capital Markets
- /
- SEHK:8017
TradeGo FinTech Limited (HKG:8017) Shares May Have Slumped 29% But Getting In Cheap Is Still Unlikely
Unfortunately for some shareholders, the TradeGo FinTech Limited (HKG:8017) share price has dived 29% in the last thirty days, prolonging recent pain. Looking at the bigger picture, even after this poor month the stock is up 58% in the last year.
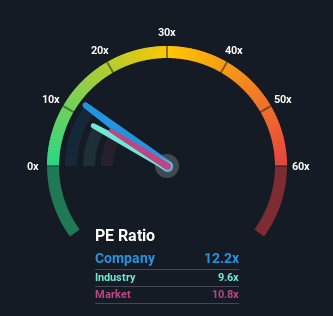
In spite of the heavy fall in price, there still wouldn't be many who think TradeGo FinTech's price-to-earnings (or "P/E") ratio of 12.2x is worth a mention when the median P/E in Hong Kong is similar at about 11x. Although, it's not wise to simply ignore the P/E without explanation as investors may be disregarding a distinct opportunity or a costly mistake.
Recent times have been quite advantageous for TradeGo FinTech as its earnings have been rising very briskly. The P/E is probably moderate because investors think this strong earnings growth might not be enough to outperform the broader market in the near future. If that doesn't eventuate, then existing shareholders have reason to be feeling optimistic about the future direction of the share price.
See our latest analysis for TradeGo FinTech

Does Growth Match The P/E?
In order to justify its P/E ratio, TradeGo FinTech would need to produce growth that's similar to the market.
Retrospectively, the last year delivered an exceptional 44% gain to the company's bottom line. However, the latest three year period hasn't been as great in aggregate as it didn't manage to provide any growth at all. Accordingly, shareholders probably wouldn't have been overly satisfied with the unstable medium-term growth rates.
Comparing that to the market, which is predicted to deliver 24% growth in the next 12 months, the company's momentum is weaker based on recent medium-term annualised earnings results.
In light of this, it's curious that TradeGo FinTech's P/E sits in line with the majority of other companies. It seems most investors are ignoring the fairly limited recent growth rates and are willing to pay up for exposure to the stock. They may be setting themselves up for future disappointment if the P/E falls to levels more in line with recent growth rates.
The Final Word
TradeGo FinTech's plummeting stock price has brought its P/E right back to the rest of the market. While the price-to-earnings ratio shouldn't be the defining factor in whether you buy a stock or not, it's quite a capable barometer of earnings expectations.
Our examination of TradeGo FinTech revealed its three-year earnings trends aren't impacting its P/E as much as we would have predicted, given they look worse than current market expectations. When we see weak earnings with slower than market growth, we suspect the share price is at risk of declining, sending the moderate P/E lower. Unless the recent medium-term conditions improve, it's challenging to accept these prices as being reasonable.
You should always think about risks. Case in point, we've spotted 3 warning signs for TradeGo FinTech you should be aware of.
You might be able to find a better investment than TradeGo FinTech. If you want a selection of possible candidates, check out this free list of interesting companies that trade on a P/E below 20x (but have proven they can grow earnings).
If you’re looking to trade a wide range of investments, open an account with the lowest-cost* platform trusted by professionals, Interactive Brokers. Their clients from over 200 countries and territories trade stocks, options, futures, forex, bonds and funds worldwide from a single integrated account. Promoted
Valuation is complex, but we're here to simplify it.
Discover if TradeGo FinTech might be undervalued or overvalued with our detailed analysis, featuring fair value estimates, potential risks, dividends, insider trades, and its financial condition.
Access Free AnalysisThis article by Simply Wall St is general in nature. It does not constitute a recommendation to buy or sell any stock, and does not take account of your objectives, or your financial situation. We aim to bring you long-term focused analysis driven by fundamental data. Note that our analysis may not factor in the latest price-sensitive company announcements or qualitative material. Simply Wall St has no position in any stocks mentioned.
*Interactive Brokers Rated Lowest Cost Broker by StockBrokers.com Annual Online Review 2020
Have feedback on this article? Concerned about the content? Get in touch with us directly. Alternatively, email editorial-team (at) simplywallst.com.
About SEHK:8017
TradeGo FinTech
An investment holding company, provides integrated securities trading platform services to brokerage firms and their clients in Hong Kong and the People’s Republic of China.
Flawless balance sheet with solid track record.
Similar Companies
Market Insights
Community Narratives


Recently Updated Narratives

Proximus: The State-Backed Backup Plan with 7% Gross Yield and 15% Currency Upside.

CEO: We are winners in the long term in the AI world

Early mover in a fast growing industry. Likely to experience share price volatility as they scale
Popular Narratives


MicroVision will explode future revenue by 380.37% with a vision towards success


The company that turned a verb into a global necessity and basically runs the modern internet, digital ads, smartphones, maps, and AI.


