- Hong Kong
- /
- Capital Markets
- /
- SEHK:174
Gemini Investments (Holdings) Limited (HKG:174) Held Back By Insufficient Growth Even After Shares Climb 31%


Gemini Investments (Holdings) Limited (HKG:174) shares have had a really impressive month, gaining 31% after a shaky period beforehand. Not all shareholders will be feeling jubilant, since the share price is still down a very disappointing 44% in the last twelve months.
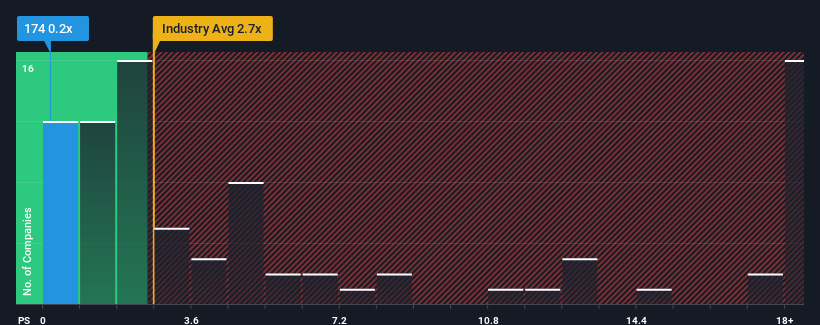
Even after such a large jump in price, Gemini Investments (Holdings) may still be sending very bullish signals at the moment with its price-to-sales (or "P/S") ratio of 0.2x, since almost half of all companies in the Capital Markets industry in Hong Kong have P/S ratios greater than 2.7x and even P/S higher than 14x are not unusual. Nonetheless, we'd need to dig a little deeper to determine if there is a rational basis for the highly reduced P/S.
View our latest analysis for Gemini Investments (Holdings)
How Has Gemini Investments (Holdings) Performed Recently?
We'd have to say that with no tangible growth over the last year, Gemini Investments (Holdings)'s revenue has been unimpressive. It might be that many expect the uninspiring revenue performance to worsen, which has repressed the P/S. If you like the company, you'd be hoping this isn't the case so that you could potentially pick up some stock while it's out of favour.
Although there are no analyst estimates available for Gemini Investments (Holdings), take a look at this free data-rich visualisation to see how the company stacks up on earnings, revenue and cash flow.Is There Any Revenue Growth Forecasted For Gemini Investments (Holdings)?
The only time you'd be truly comfortable seeing a P/S as depressed as Gemini Investments (Holdings)'s is when the company's growth is on track to lag the industry decidedly.
If we review the last year of revenue, the company posted a result that saw barely any deviation from a year ago. However, a few strong years before that means that it was still able to grow revenue by an impressive 76% in total over the last three years. So while the company has done a solid job in the past, it's somewhat concerning to see revenue growth decline as much as it has.
This is in contrast to the rest of the industry, which is expected to grow by 39% over the next year, materially higher than the company's recent medium-term annualised growth rates.
With this in consideration, it's easy to understand why Gemini Investments (Holdings)'s P/S falls short of the mark set by its industry peers. It seems most investors are expecting to see the recent limited growth rates continue into the future and are only willing to pay a reduced amount for the stock.
What Does Gemini Investments (Holdings)'s P/S Mean For Investors?
Even after such a strong price move, Gemini Investments (Holdings)'s P/S still trails the rest of the industry. While the price-to-sales ratio shouldn't be the defining factor in whether you buy a stock or not, it's quite a capable barometer of revenue expectations.
As we suspected, our examination of Gemini Investments (Holdings) revealed its three-year revenue trends are contributing to its low P/S, given they look worse than current industry expectations. Right now shareholders are accepting the low P/S as they concede future revenue probably won't provide any pleasant surprises. If recent medium-term revenue trends continue, it's hard to see the share price experience a reversal of fortunes anytime soon.
Having said that, be aware Gemini Investments (Holdings) is showing 2 warning signs in our investment analysis, and 1 of those doesn't sit too well with us.
If you're unsure about the strength of Gemini Investments (Holdings)'s business, why not explore our interactive list of stocks with solid business fundamentals for some other companies you may have missed.
New: Manage All Your Stock Portfolios in One Place
We've created the ultimate portfolio companion for stock investors, and it's free.
• Connect an unlimited number of Portfolios and see your total in one currency
• Be alerted to new Warning Signs or Risks via email or mobile
• Track the Fair Value of your stocks
Have feedback on this article? Concerned about the content? Get in touch with us directly. Alternatively, email editorial-team (at) simplywallst.com.
This article by Simply Wall St is general in nature. We provide commentary based on historical data and analyst forecasts only using an unbiased methodology and our articles are not intended to be financial advice. It does not constitute a recommendation to buy or sell any stock, and does not take account of your objectives, or your financial situation. We aim to bring you long-term focused analysis driven by fundamental data. Note that our analysis may not factor in the latest price-sensitive company announcements or qualitative material. Simply Wall St has no position in any stocks mentioned.
About SEHK:174
Gemini Investments (Holdings)
An investment holding company, engages in property investment, property development, and other businesses in Hong Kong, the United States, and internationally.
Mediocre balance sheet and slightly overvalued.
Market Insights

Community Narratives

