- Hong Kong
- /
- Consumer Services
- /
- SEHK:8363
SDM Education Group Holdings Limited (HKG:8363) Soars 26% But It's A Story Of Risk Vs Reward


Despite an already strong run, SDM Education Group Holdings Limited (HKG:8363) shares have been powering on, with a gain of 26% in the last thirty days. Looking back a bit further, it's encouraging to see the stock is up 88% in the last year.
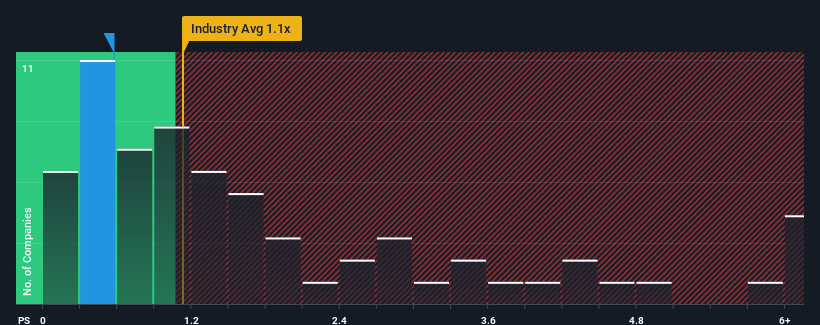
Even after such a large jump in price, considering around half the companies operating in Hong Kong's Consumer Services industry have price-to-sales ratios (or "P/S") above 1.1x, you may still consider SDM Education Group Holdings as an solid investment opportunity with its 0.6x P/S ratio. Nonetheless, we'd need to dig a little deeper to determine if there is a rational basis for the reduced P/S.
View our latest analysis for SDM Education Group Holdings
What Does SDM Education Group Holdings' Recent Performance Look Like?
SDM Education Group Holdings has been doing a good job lately as it's been growing revenue at a solid pace. One possibility is that the P/S is low because investors think this respectable revenue growth might actually underperform the broader industry in the near future. If you like the company, you'd be hoping this isn't the case so that you could potentially pick up some stock while it's out of favour.
Want the full picture on earnings, revenue and cash flow for the company? Then our free report on SDM Education Group Holdings will help you shine a light on its historical performance.How Is SDM Education Group Holdings' Revenue Growth Trending?
SDM Education Group Holdings' P/S ratio would be typical for a company that's only expected to deliver limited growth, and importantly, perform worse than the industry.
If we review the last year of revenue growth, the company posted a terrific increase of 22%. The strong recent performance means it was also able to grow revenue by 79% in total over the last three years. So we can start by confirming that the company has done a great job of growing revenue over that time.
Comparing that to the industry, which is predicted to deliver 20% growth in the next 12 months, the company's momentum is pretty similar based on recent medium-term annualised revenue results.
With this in consideration, we find it intriguing that SDM Education Group Holdings' P/S falls short of its industry peers. It may be that most investors are not convinced the company can maintain recent growth rates.
The Key Takeaway
The latest share price surge wasn't enough to lift SDM Education Group Holdings' P/S close to the industry median. It's argued the price-to-sales ratio is an inferior measure of value within certain industries, but it can be a powerful business sentiment indicator.
The fact that SDM Education Group Holdings currently trades at a low P/S relative to the industry is unexpected considering its recent three-year growth is in line with the wider industry forecast. When we see industry-like revenue growth but a lower than expected P/S, we assume potential risks are what might be placing downward pressure on the share price. While recent
Before you take the next step, you should know about the 3 warning signs for SDM Education Group Holdings (2 shouldn't be ignored!) that we have uncovered.
It's important to make sure you look for a great company, not just the first idea you come across. So if growing profitability aligns with your idea of a great company, take a peek at this free list of interesting companies with strong recent earnings growth (and a low P/E).
If you're looking to trade SDM Education Group Holdings, open an account with the lowest-cost platform trusted by professionals, Interactive Brokers.
With clients in over 200 countries and territories, and access to 160 markets, IBKR lets you trade stocks, options, futures, forex, bonds and funds from a single integrated account.
Enjoy no hidden fees, no account minimums, and FX conversion rates as low as 0.03%, far better than what most brokers offer.
Sponsored ContentNew: Manage All Your Stock Portfolios in One Place
We've created the ultimate portfolio companion for stock investors, and it's free.
• Connect an unlimited number of Portfolios and see your total in one currency
• Be alerted to new Warning Signs or Risks via email or mobile
• Track the Fair Value of your stocks
Have feedback on this article? Concerned about the content? Get in touch with us directly. Alternatively, email editorial-team (at) simplywallst.com.
This article by Simply Wall St is general in nature. We provide commentary based on historical data and analyst forecasts only using an unbiased methodology and our articles are not intended to be financial advice. It does not constitute a recommendation to buy or sell any stock, and does not take account of your objectives, or your financial situation. We aim to bring you long-term focused analysis driven by fundamental data. Note that our analysis may not factor in the latest price-sensitive company announcements or qualitative material. Simply Wall St has no position in any stocks mentioned.
About SEHK:8363
SDM Education Group Holdings
An investment holding company, operates dance institutions for children in Hong Kong and Singapore.
Moderate and good value.
Market Insights

Community Narratives

