- Hong Kong
- /
- Consumer Services
- /
- SEHK:1773
Here's What To Make Of Tianli International Holdings' (HKG:1773) Decelerating Rates Of Return


What trends should we look for it we want to identify stocks that can multiply in value over the long term? Firstly, we'd want to identify a growing return on capital employed (ROCE) and then alongside that, an ever-increasing base of capital employed. If you see this, it typically means it's a company with a great business model and plenty of profitable reinvestment opportunities. In light of that, when we looked at Tianli International Holdings (HKG:1773) and its ROCE trend, we weren't exactly thrilled.
What Is Return On Capital Employed (ROCE)?
Just to clarify if you're unsure, ROCE is a metric for evaluating how much pre-tax income (in percentage terms) a company earns on the capital invested in its business. To calculate this metric for Tianli International Holdings, this is the formula:
Return on Capital Employed = Earnings Before Interest and Tax (EBIT) ÷ (Total Assets - Current Liabilities)
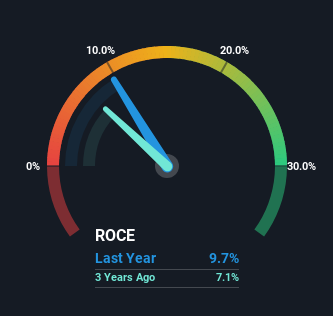
0.097 = CN¥485m ÷ (CN¥9.6b - CN¥4.6b) (Based on the trailing twelve months to August 2023).
So, Tianli International Holdings has an ROCE of 9.7%. On its own that's a low return on capital but it's in line with the industry's average returns of 9.8%.
Check out our latest analysis for Tianli International Holdings
Above you can see how the current ROCE for Tianli International Holdings compares to its prior returns on capital, but there's only so much you can tell from the past. If you're interested, you can view the analysts predictions in our free report on analyst forecasts for the company.
What Can We Tell From Tianli International Holdings' ROCE Trend?
In terms of Tianli International Holdings' historical ROCE trend, it doesn't exactly demand attention. Over the past five years, ROCE has remained relatively flat at around 9.7% and the business has deployed 114% more capital into its operations. Given the company has increased the amount of capital employed, it appears the investments that have been made simply don't provide a high return on capital.
Another point to note, we noticed the company has increased current liabilities over the last five years. This is intriguing because if current liabilities hadn't increased to 48% of total assets, this reported ROCE would probably be less than9.7% because total capital employed would be higher.The 9.7% ROCE could be even lower if current liabilities weren't 48% of total assets, because the the formula would show a larger base of total capital employed. So with current liabilities at such high levels, this effectively means the likes of suppliers or short-term creditors are funding a meaningful part of the business, which in some instances can bring some risks.
In Conclusion...
In summary, Tianli International Holdings has simply been reinvesting capital and generating the same low rate of return as before. Investors must think there's better things to come because the stock has knocked it out of the park, delivering a 109% gain to shareholders who have held over the last five years. But if the trajectory of these underlying trends continue, we think the likelihood of it being a multi-bagger from here isn't high.
If you want to continue researching Tianli International Holdings, you might be interested to know about the 1 warning sign that our analysis has discovered.
While Tianli International Holdings may not currently earn the highest returns, we've compiled a list of companies that currently earn more than 25% return on equity. Check out this free list here.
If you're looking to trade Tianli International Holdings, open an account with the lowest-cost platform trusted by professionals, Interactive Brokers.
With clients in over 200 countries and territories, and access to 160 markets, IBKR lets you trade stocks, options, futures, forex, bonds and funds from a single integrated account.
Enjoy no hidden fees, no account minimums, and FX conversion rates as low as 0.03%, far better than what most brokers offer.
Sponsored ContentValuation is complex, but we're here to simplify it.
Discover if Tianli International Holdings might be undervalued or overvalued with our detailed analysis, featuring fair value estimates, potential risks, dividends, insider trades, and its financial condition.
Access Free AnalysisHave feedback on this article? Concerned about the content? Get in touch with us directly. Alternatively, email editorial-team (at) simplywallst.com.
This article by Simply Wall St is general in nature. We provide commentary based on historical data and analyst forecasts only using an unbiased methodology and our articles are not intended to be financial advice. It does not constitute a recommendation to buy or sell any stock, and does not take account of your objectives, or your financial situation. We aim to bring you long-term focused analysis driven by fundamental data. Note that our analysis may not factor in the latest price-sensitive company announcements or qualitative material. Simply Wall St has no position in any stocks mentioned.
About SEHK:1773
Tianli International Holdings
An investment holding company, provides education management and diversified services in China.
Exceptional growth potential with outstanding track record.
Market Insights

Community Narratives

