
Advertisement
- Hong Kong
- /
- Consumer Services
- /
- SEHK:1765
XJ International Holdings (HKG:1765) Has More To Do To Multiply In Value Going Forward
If you're looking for a multi-bagger, there's a few things to keep an eye out for. Typically, we'll want to notice a trend of growing return on capital employed (ROCE) and alongside that, an expanding base of capital employed. If you see this, it typically means it's a company with a great business model and plenty of profitable reinvestment opportunities. Having said that, from a first glance at XJ International Holdings (HKG:1765) we aren't jumping out of our chairs at how returns are trending, but let's have a deeper look.
Return On Capital Employed (ROCE): What Is It?
If you haven't worked with ROCE before, it measures the 'return' (pre-tax profit) a company generates from capital employed in its business. Analysts use this formula to calculate it for XJ International Holdings:
Return on Capital Employed = Earnings Before Interest and Tax (EBIT) ÷ (Total Assets - Current Liabilities)
0.06 = CN¥752m ÷ (CN¥21b - CN¥8.2b) (Based on the trailing twelve months to February 2025).
So, XJ International Holdings has an ROCE of 6.0%. In absolute terms, that's a low return and it also under-performs the Consumer Services industry average of 9.1%.
Check out our latest analysis for XJ International Holdings
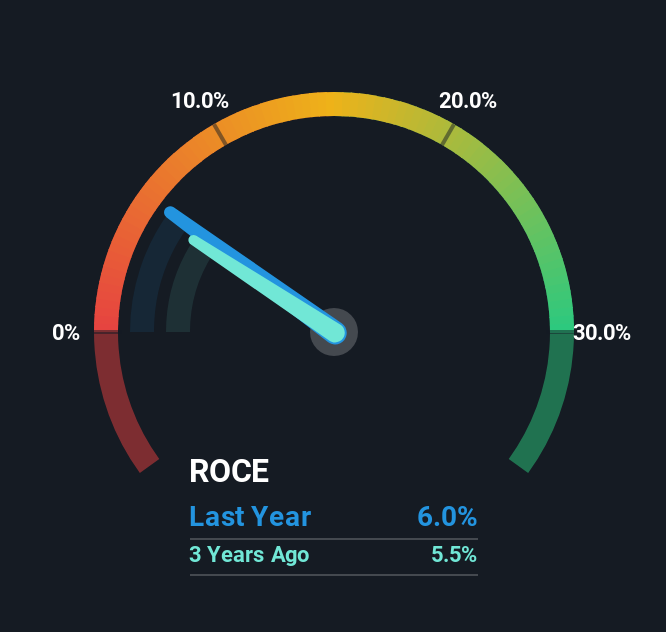
While the past is not representative of the future, it can be helpful to know how a company has performed historically, which is why we have this chart above. If you want to delve into the historical earnings , check out these free graphs detailing revenue and cash flow performance of XJ International Holdings.
The Trend Of ROCE
In terms of XJ International Holdings' historical ROCE trend, it doesn't exactly demand attention. The company has employed 55% more capital in the last five years, and the returns on that capital have remained stable at 6.0%. Given the company has increased the amount of capital employed, it appears the investments that have been made simply don't provide a high return on capital.
On another note, while the change in ROCE trend might not scream for attention, it's interesting that the current liabilities have actually gone up over the last five years. This is intriguing because if current liabilities hadn't increased to 40% of total assets, this reported ROCE would probably be less than6.0% because total capital employed would be higher.The 6.0% ROCE could be even lower if current liabilities weren't 40% of total assets, because the the formula would show a larger base of total capital employed. So while current liabilities isn't high right now, keep an eye out in case it increases further, because this can introduce some elements of risk.

The Bottom Line
In summary, XJ International Holdings has simply been reinvesting capital and generating the same low rate of return as before. It seems that investors have little hope of these trends getting any better and that may have partly contributed to the stock collapsing 93% in the last five years. In any case, the stock doesn't have these traits of a multi-bagger discussed above, so if that's what you're looking for, we think you'd have more luck elsewhere.
While XJ International Holdings doesn't shine too bright in this respect, it's still worth seeing if the company is trading at attractive prices. You can find that out with our FREE intrinsic value estimation for 1765 on our platform.
While XJ International Holdings may not currently earn the highest returns, we've compiled a list of companies that currently earn more than 25% return on equity. Check out this free list here.
New: AI Stock Screener & Alerts
Our new AI Stock Screener scans the market every day to uncover opportunities.
• Dividend Powerhouses (3%+ Yield)
• Undervalued Small Caps with Insider Buying
• High growth Tech and AI Companies
Or build your own from over 50 metrics.
Have feedback on this article? Concerned about the content? Get in touch with us directly. Alternatively, email editorial-team (at) simplywallst.com.
This article by Simply Wall St is general in nature. We provide commentary based on historical data and analyst forecasts only using an unbiased methodology and our articles are not intended to be financial advice. It does not constitute a recommendation to buy or sell any stock, and does not take account of your objectives, or your financial situation. We aim to bring you long-term focused analysis driven by fundamental data. Note that our analysis may not factor in the latest price-sensitive company announcements or qualitative material. Simply Wall St has no position in any stocks mentioned.
About SEHK:1765
XJ International Holdings
An investment holding company, engages in the provision of higher education and secondary vocational education services in China and Malaysia.
Solid track record and good value.
Market Insights

Advertisement
Community Narratives
MicroVision will explode future revenue by 380.37% with a vision towards success
Fair Value US$60.00|98.4% undervalued
TH
Community Contributor
The Indispensable Artery for a New North American Economy
Fair Value CA$132.87|1.3% undervalued
TI
Community Contributor