
Advertisement
- Hong Kong
- /
- Hospitality
- /
- SEHK:1128
Reflecting on Wynn Macau's (HKG:1128) Share Price Returns Over The Last Three Years
Wynn Macau, Limited (HKG:1128) shareholders should be happy to see the share price up 19% in the last month. But that cannot eclipse the less-than-impressive returns over the last three years. After all, the share price is down 39% in the last three years, significantly under-performing the market.
Check out our latest analysis for Wynn Macau
Wynn Macau isn't currently profitable, so most analysts would look to revenue growth to get an idea of how fast the underlying business is growing. Generally speaking, companies without profits are expected to grow revenue every year, and at a good clip. That's because fast revenue growth can be easily extrapolated to forecast profits, often of considerable size.
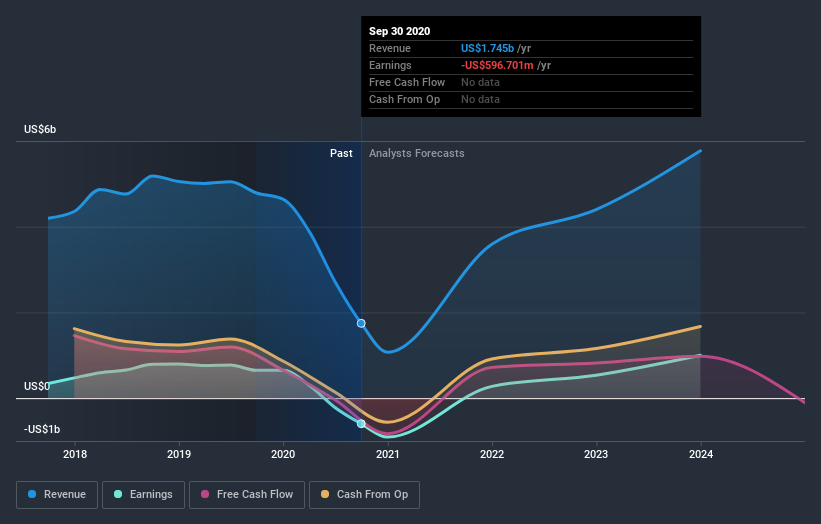
Over the last three years, Wynn Macau's revenue dropped 14% per year. That's not what investors generally want to see. The annual decline of 11% per year in that period has clearly disappointed holders. That makes sense given the lack of either profits or revenue growth. However, in this kind of situation you can sometimes find opportunity, where sentiment is negative but the company is actually making good progress.
The company's revenue and earnings (over time) are depicted in the image below (click to see the exact numbers).
Wynn Macau is well known by investors, and plenty of clever analysts have tried to predict the future profit levels. So it makes a lot of sense to check out what analysts think Wynn Macau will earn in the future (free analyst consensus estimates)
What about the Total Shareholder Return (TSR)?
We've already covered Wynn Macau's share price action, but we should also mention its total shareholder return (TSR). Arguably the TSR is a more complete return calculation because it accounts for the value of dividends (as if they were reinvested), along with the hypothetical value of any discounted capital that have been offered to shareholders. Its history of dividend payouts mean that Wynn Macau's TSR, which was a 31% drop over the last 3 years, was not as bad as the share price return.
A Different Perspective
Investors in Wynn Macau had a tough year, with a total loss of 22%, against a market gain of about 13%. However, keep in mind that even the best stocks will sometimes underperform the market over a twelve month period. On the bright side, long term shareholders have made money, with a gain of 9% per year over half a decade. It could be that the recent sell-off is an opportunity, so it may be worth checking the fundamental data for signs of a long term growth trend. I find it very interesting to look at share price over the long term as a proxy for business performance. But to truly gain insight, we need to consider other information, too. To that end, you should be aware of the 1 warning sign we've spotted with Wynn Macau .
But note: Wynn Macau may not be the best stock to buy. So take a peek at this free list of interesting companies with past earnings growth (and further growth forecast).
Please note, the market returns quoted in this article reflect the market weighted average returns of stocks that currently trade on HK exchanges.
If you decide to trade Wynn Macau, use the lowest-cost* platform that is rated #1 Overall by Barron’s, Interactive Brokers. Trade stocks, options, futures, forex, bonds and funds on 135 markets, all from a single integrated account. Promoted
Valuation is complex, but we're here to simplify it.
Discover if Wynn Macau might be undervalued or overvalued with our detailed analysis, featuring fair value estimates, potential risks, dividends, insider trades, and its financial condition.
Access Free AnalysisThis article by Simply Wall St is general in nature. It does not constitute a recommendation to buy or sell any stock, and does not take account of your objectives, or your financial situation. We aim to bring you long-term focused analysis driven by fundamental data. Note that our analysis may not factor in the latest price-sensitive company announcements or qualitative material. Simply Wall St has no position in any stocks mentioned.
*Interactive Brokers Rated Lowest Cost Broker by StockBrokers.com Annual Online Review 2020
Have feedback on this article? Concerned about the content? Get in touch with us directly. Alternatively, email editorial-team@simplywallst.com.
About SEHK:1128
Wynn Macau
Owns, develops, and operates integrated destination casino resorts in the People’s Republic of China.
Slight risk and fair value.
Similar Companies
Market Insights

Advertisement
Community Narratives
Quality at a Premium. A time to watch, not to buy?
Fair Value US$154.56|29.0% undervalued
DA
Community Contributor
GRAB: The Super-App at the Heart of Southeast Asia’s Digital Boom
Fair Value US$8.20|22.6% undervalued
BL
Community Contributor
Verve Group to Surge with 51.61% Revenue Growth
Fair Value €6.00|60.1% undervalued
ME
Community Contributor