
Advertisement
- Hong Kong
- /
- Food and Staples Retail
- /
- SEHK:9886
Dingdang Health Technology Group Ltd. (HKG:9886) Stocks Pounded By 42% But Not Lagging Industry On Growth Or Pricing
Dingdang Health Technology Group Ltd. (HKG:9886) shares have retraced a considerable 42% in the last month, reversing a fair amount of their solid recent performance. For any long-term shareholders, the last month ends a year to forget by locking in a 52% share price decline.
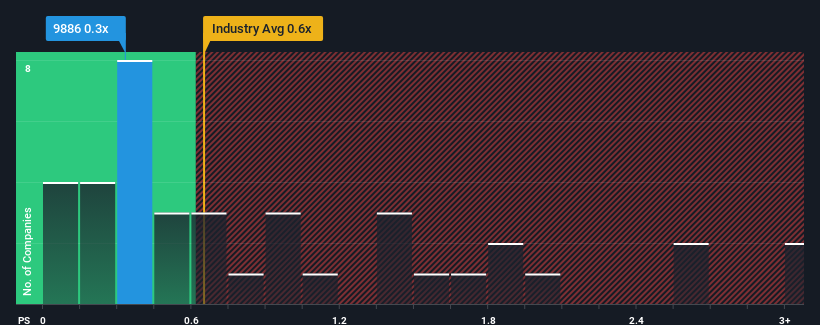
In spite of the heavy fall in price, it's still not a stretch to say that Dingdang Health Technology Group's price-to-sales (or "P/S") ratio of 0.3x right now seems quite "middle-of-the-road" compared to the Consumer Retailing industry in Hong Kong, where the median P/S ratio is around 0.6x. However, investors might be overlooking a clear opportunity or potential setback if there is no rational basis for the P/S.
View our latest analysis for Dingdang Health Technology Group
How Has Dingdang Health Technology Group Performed Recently?
There hasn't been much to differentiate Dingdang Health Technology Group's and the industry's revenue growth lately. Perhaps the market is expecting future revenue performance to show no drastic signs of changing, justifying the P/S being at current levels. Those who are bullish on Dingdang Health Technology Group will be hoping that revenue performance can pick up, so that they can pick up the stock at a slightly lower valuation.
Keen to find out how analysts think Dingdang Health Technology Group's future stacks up against the industry? In that case, our free report is a great place to start.What Are Revenue Growth Metrics Telling Us About The P/S?
In order to justify its P/S ratio, Dingdang Health Technology Group would need to produce growth that's similar to the industry.
Taking a look back first, we see that the company managed to grow revenues by a handy 12% last year. Pleasingly, revenue has also lifted 118% in aggregate from three years ago, partly thanks to the last 12 months of growth. Accordingly, shareholders would have definitely welcomed those medium-term rates of revenue growth.
Shifting to the future, estimates from the dual analysts covering the company suggest revenue should grow by 12% per annum over the next three years. Meanwhile, the rest of the industry is forecast to expand by 14% per year, which is not materially different.
In light of this, it's understandable that Dingdang Health Technology Group's P/S sits in line with the majority of other companies. It seems most investors are expecting to see average future growth and are only willing to pay a moderate amount for the stock.
What We Can Learn From Dingdang Health Technology Group's P/S?
Dingdang Health Technology Group's plummeting stock price has brought its P/S back to a similar region as the rest of the industry. Using the price-to-sales ratio alone to determine if you should sell your stock isn't sensible, however it can be a practical guide to the company's future prospects.
Our look at Dingdang Health Technology Group's revenue growth estimates show that its P/S is about what we expect, as both metrics follow closely with the industry averages. Right now shareholders are comfortable with the P/S as they are quite confident future revenue won't throw up any surprises. Unless these conditions change, they will continue to support the share price at these levels.
It is also worth noting that we have found 1 warning sign for Dingdang Health Technology Group that you need to take into consideration.
Of course, profitable companies with a history of great earnings growth are generally safer bets. So you may wish to see this free collection of other companies that have reasonable P/E ratios and have grown earnings strongly.
New: Manage All Your Stock Portfolios in One Place
We've created the ultimate portfolio companion for stock investors, and it's free.
• Connect an unlimited number of Portfolios and see your total in one currency
• Be alerted to new Warning Signs or Risks via email or mobile
• Track the Fair Value of your stocks
Have feedback on this article? Concerned about the content? Get in touch with us directly. Alternatively, email editorial-team (at) simplywallst.com.
This article by Simply Wall St is general in nature. We provide commentary based on historical data and analyst forecasts only using an unbiased methodology and our articles are not intended to be financial advice. It does not constitute a recommendation to buy or sell any stock, and does not take account of your objectives, or your financial situation. We aim to bring you long-term focused analysis driven by fundamental data. Note that our analysis may not factor in the latest price-sensitive company announcements or qualitative material. Simply Wall St has no position in any stocks mentioned.
About SEHK:9886
Dingdang Health Technology Group
Provides digital healthcare services in the People’s Republic of China.
Flawless balance sheet and good value.
Market Insights

Advertisement
Community Narratives
Kodiak AI - a potential 100 bagger opportunity?
Fair Value US$14.00|44.7% undervalued
DA
Community Contributor
A Fair Price for a Great Business Facing Real Threats
Fair Value US$383.06|13.0% undervalued
IM
Community Contributor
AXON And Shopify Integration Will Unlock Global Mobile Advertising
Fair Value US$646.30|0% overvalued
AN
Based on Analyst Price Targets