
Advertisement
- Hong Kong
- /
- Food and Staples Retail
- /
- SEHK:8491
Subdued Growth No Barrier To Cool Link (Holdings) Limited (HKG:8491) With Shares Advancing 28%
The Cool Link (Holdings) Limited (HKG:8491) share price has done very well over the last month, posting an excellent gain of 28%. Not all shareholders will be feeling jubilant, since the share price is still down a very disappointing 32% in the last twelve months.
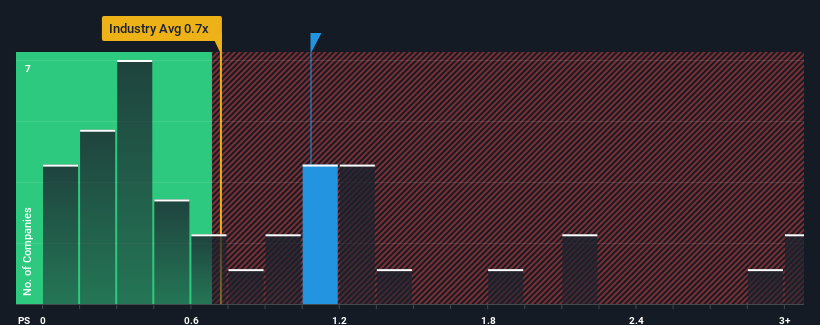
In spite of the firm bounce in price, you could still be forgiven for feeling indifferent about Cool Link (Holdings)'s P/S ratio of 1.1x, since the median price-to-sales (or "P/S") ratio for the Consumer Retailing industry in Hong Kong is also close to 0.7x. Although, it's not wise to simply ignore the P/S without explanation as investors may be disregarding a distinct opportunity or a costly mistake.
View our latest analysis for Cool Link (Holdings)
What Does Cool Link (Holdings)'s Recent Performance Look Like?
For instance, Cool Link (Holdings)'s receding revenue in recent times would have to be some food for thought. One possibility is that the P/S is moderate because investors think the company might still do enough to be in line with the broader industry in the near future. If you like the company, you'd at least be hoping this is the case so that you could potentially pick up some stock while it's not quite in favour.
We don't have analyst forecasts, but you can see how recent trends are setting up the company for the future by checking out our free report on Cool Link (Holdings)'s earnings, revenue and cash flow.How Is Cool Link (Holdings)'s Revenue Growth Trending?
Cool Link (Holdings)'s P/S ratio would be typical for a company that's only expected to deliver moderate growth, and importantly, perform in line with the industry.
Retrospectively, the last year delivered a frustrating 11% decrease to the company's top line. This has soured the latest three-year period, which nevertheless managed to deliver a decent 12% overall rise in revenue. Accordingly, while they would have preferred to keep the run going, shareholders would be roughly satisfied with the medium-term rates of revenue growth.
This is in contrast to the rest of the industry, which is expected to grow by 13% over the next year, materially higher than the company's recent medium-term annualised growth rates.
With this information, we find it interesting that Cool Link (Holdings) is trading at a fairly similar P/S compared to the industry. Apparently many investors in the company are less bearish than recent times would indicate and aren't willing to let go of their stock right now. They may be setting themselves up for future disappointment if the P/S falls to levels more in line with recent growth rates.
The Bottom Line On Cool Link (Holdings)'s P/S
Cool Link (Holdings)'s stock has a lot of momentum behind it lately, which has brought its P/S level with the rest of the industry. We'd say the price-to-sales ratio's power isn't primarily as a valuation instrument but rather to gauge current investor sentiment and future expectations.
Our examination of Cool Link (Holdings) revealed its poor three-year revenue trends aren't resulting in a lower P/S as per our expectations, given they look worse than current industry outlook. Right now we are uncomfortable with the P/S as this revenue performance isn't likely to support a more positive sentiment for long. Unless there is a significant improvement in the company's medium-term performance, it will be difficult to prevent the P/S ratio from declining to a more reasonable level.
Before you take the next step, you should know about the 3 warning signs for Cool Link (Holdings) (2 are concerning!) that we have uncovered.
If strong companies turning a profit tickle your fancy, then you'll want to check out this free list of interesting companies that trade on a low P/E (but have proven they can grow earnings).
New: AI Stock Screener & Alerts
Our new AI Stock Screener scans the market every day to uncover opportunities.
• Dividend Powerhouses (3%+ Yield)
• Undervalued Small Caps with Insider Buying
• High growth Tech and AI Companies
Or build your own from over 50 metrics.
Have feedback on this article? Concerned about the content? Get in touch with us directly. Alternatively, email editorial-team (at) simplywallst.com.
This article by Simply Wall St is general in nature. We provide commentary based on historical data and analyst forecasts only using an unbiased methodology and our articles are not intended to be financial advice. It does not constitute a recommendation to buy or sell any stock, and does not take account of your objectives, or your financial situation. We aim to bring you long-term focused analysis driven by fundamental data. Note that our analysis may not factor in the latest price-sensitive company announcements or qualitative material. Simply Wall St has no position in any stocks mentioned.
About SEHK:8491
Cool Link (Holdings)
An investment holding company, engages in food and healthcare supplies business in Singapore, Indonesia, Malaysia, and internationally.
Flawless balance sheet with very low risk.
Similar Companies
Market Insights

Advertisement
Community Narratives
MINISO's fair value is projected at 26.69 with an anticipated PE ratio shift of 20x
Fair Value US$24.03|11.0% undervalued
BE
Community Contributor
Procter & Gamble: A Dividend Giant Facing Slowing Growth
Fair Value US$119.81|23.3% overvalued
AN
Community Contributor
Eli Lilly's Future Growth Driven by Tirzepatide and Favorable Market Conditions
Fair Value US$1.19k|13.8% undervalued
EA
Community Contributor