- Hong Kong
- /
- Food and Staples Retail
- /
- SEHK:6618
This Is Why JD Health International Inc.'s (HKG:6618) CEO Compensation Looks Appropriate

Key Insights
- JD Health International to hold its Annual General Meeting on 21st of June
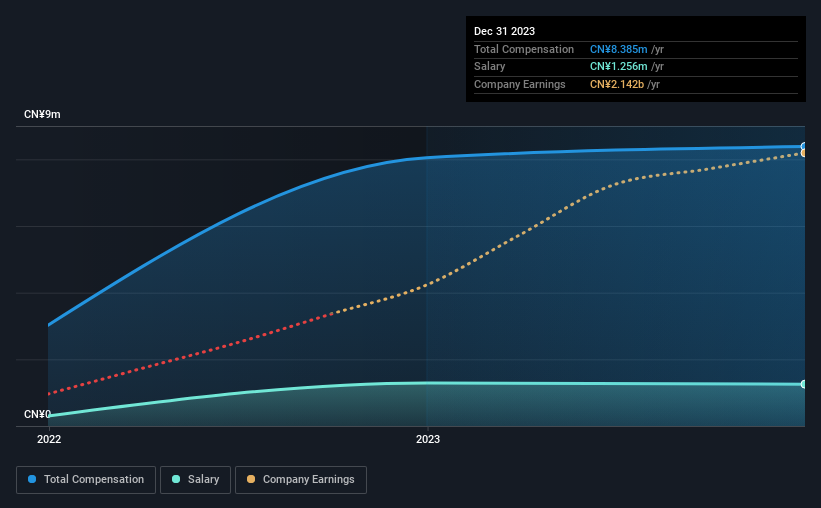
- CEO Enlin Jin's total compensation includes salary of CN¥1.26m
- The overall pay is 87% below the industry average
- Over the past three years, JD Health International's EPS grew by 137% and over the past three years, the total loss to shareholders 77%
Performance at JD Health International Inc. (HKG:6618) has been rather uninspiring recently and shareholders may be wondering how CEO Enlin Jin plans to fix this. At the next AGM coming up on 21st of June, they can influence managerial decision making through voting on resolutions, including executive remuneration. It has been shown that setting appropriate executive remuneration incentivises the management to act in the interests of shareholders. We think CEO compensation looks appropriate given the data we have put together.
See our latest analysis for JD Health International
How Does Total Compensation For Enlin Jin Compare With Other Companies In The Industry?
Our data indicates that JD Health International Inc. has a market capitalization of HK$78b, and total annual CEO compensation was reported as CN¥8.4m for the year to December 2023. That's just a smallish increase of 4.2% on last year. While we always look at total compensation first, our analysis shows that the salary component is less, at CN¥1.3m.
On comparing similar companies in the Hong Kong Consumer Retailing industry with market capitalizations above HK$62b, we found that the median total CEO compensation was CN¥64m. That is to say, Enlin Jin is paid under the industry median. What's more, Enlin Jin holds HK$8.1m worth of shares in the company in their own name, indicating that they have a lot of skin in the game.
| Component | 2023 | 2022 | Proportion (2023) |
| Salary | CN¥1.3m | CN¥1.3m | 15% |
| Other | CN¥7.1m | CN¥6.8m | 85% |
| Total Compensation | CN¥8.4m | CN¥8.0m | 100% |
Talking in terms of the industry, salary represented approximately 69% of total compensation out of all the companies we analyzed, while other remuneration made up 31% of the pie. JD Health International sets aside a smaller share of compensation for salary, in comparison to the overall industry. If total compensation is slanted towards non-salary benefits, it indicates that CEO pay is linked to company performance.

A Look at JD Health International Inc.'s Growth Numbers
JD Health International Inc.'s earnings per share (EPS) grew 137% per year over the last three years. Its revenue is up 15% over the last year.
This demonstrates that the company has been improving recently and is good news for the shareholders. It's a real positive to see this sort of revenue growth in a single year. That suggests a healthy and growing business. Looking ahead, you might want to check this free visual report on analyst forecasts for the company's future earnings..
Has JD Health International Inc. Been A Good Investment?
The return of -77% over three years would not have pleased JD Health International Inc. shareholders. Therefore, it might be upsetting for shareholders if the CEO were paid generously.
To Conclude...
The loss to shareholders over the past three years is certainly concerning. This diverges with the robust growth in EPS, suggesting that there is a large discrepancy between share price and fundamentals. A key question may be why the fundamentals have not yet been reflected into the share price. The upcoming AGM will provide shareholders the opportunity to raise their concerns and evaluate if the board’s judgement and decision-making is aligned with their expectations.
Shareholders may want to check for free if JD Health International insiders are buying or selling shares.
Of course, you might find a fantastic investment by looking at a different set of stocks. So take a peek at this free list of interesting companies.
New: Manage All Your Stock Portfolios in One Place
We've created the ultimate portfolio companion for stock investors, and it's free.
• Connect an unlimited number of Portfolios and see your total in one currency
• Be alerted to new Warning Signs or Risks via email or mobile
• Track the Fair Value of your stocks
Have feedback on this article? Concerned about the content? Get in touch with us directly. Alternatively, email editorial-team (at) simplywallst.com.
This article by Simply Wall St is general in nature. We provide commentary based on historical data and analyst forecasts only using an unbiased methodology and our articles are not intended to be financial advice. It does not constitute a recommendation to buy or sell any stock, and does not take account of your objectives, or your financial situation. We aim to bring you long-term focused analysis driven by fundamental data. Note that our analysis may not factor in the latest price-sensitive company announcements or qualitative material. Simply Wall St has no position in any stocks mentioned.
Have feedback on this article? Concerned about the content? Get in touch with us directly. Alternatively, email editorial-team@simplywallst.com
About SEHK:6618
JD Health International
An investment holding company, engages in the operation of an online healthcare platform in the People’s Republic of China.
Flawless balance sheet with solid track record.
Market Insights
Community Narratives


