
Advertisement
- Hong Kong
- /
- Food and Staples Retail
- /
- SEHK:6618
The Returns On Capital At JD Health International (HKG:6618) Don't Inspire Confidence

If you're looking for a multi-bagger, there's a few things to keep an eye out for. Amongst other things, we'll want to see two things; firstly, a growing return on capital employed (ROCE) and secondly, an expansion in the company's amount of capital employed. Put simply, these types of businesses are compounding machines, meaning they are continually reinvesting their earnings at ever-higher rates of return. Having said that, from a first glance at JD Health International (HKG:6618) we aren't jumping out of our chairs at how returns are trending, but let's have a deeper look.
Return On Capital Employed (ROCE): What Is It?
If you haven't worked with ROCE before, it measures the 'return' (pre-tax profit) a company generates from capital employed in its business. Analysts use this formula to calculate it for JD Health International:
Return on Capital Employed = Earnings Before Interest and Tax (EBIT) ÷ (Total Assets - Current Liabilities)
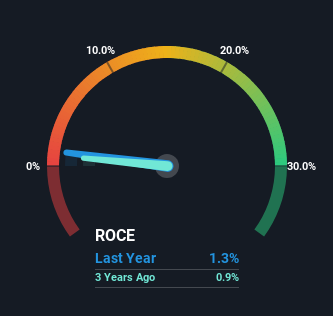
0.013 = CN¥631m ÷ (CN¥64b - CN¥15b) (Based on the trailing twelve months to December 2023).
So, JD Health International has an ROCE of 1.3%. In absolute terms, that's a low return and it also under-performs the Consumer Retailing industry average of 7.9%.
View our latest analysis for JD Health International
In the above chart we have measured JD Health International's prior ROCE against its prior performance, but the future is arguably more important. If you'd like to see what analysts are forecasting going forward, you should check out our free analyst report for JD Health International .
What Can We Tell From JD Health International's ROCE Trend?
When we looked at the ROCE trend at JD Health International, we didn't gain much confidence. Around five years ago the returns on capital were 40%, but since then they've fallen to 1.3%. Although, given both revenue and the amount of assets employed in the business have increased, it could suggest the company is investing in growth, and the extra capital has led to a short-term reduction in ROCE. If these investments prove successful, this can bode very well for long term stock performance.
On a side note, JD Health International has done well to pay down its current liabilities to 23% of total assets. So we could link some of this to the decrease in ROCE. Effectively this means their suppliers or short-term creditors are funding less of the business, which reduces some elements of risk. Some would claim this reduces the business' efficiency at generating ROCE since it is now funding more of the operations with its own money.
The Bottom Line
While returns have fallen for JD Health International in recent times, we're encouraged to see that sales are growing and that the business is reinvesting in its operations. But since the stock has dived 74% in the last three years, there could be other drivers that are influencing the business' outlook. Therefore, we'd suggest researching the stock further to uncover more about the business.
If you're still interested in JD Health International it's worth checking out our FREE intrinsic value approximation for 6618 to see if it's trading at an attractive price in other respects.
While JD Health International may not currently earn the highest returns, we've compiled a list of companies that currently earn more than 25% return on equity. Check out this free list here.
New: Manage All Your Stock Portfolios in One Place
We've created the ultimate portfolio companion for stock investors, and it's free.
• Connect an unlimited number of Portfolios and see your total in one currency
• Be alerted to new Warning Signs or Risks via email or mobile
• Track the Fair Value of your stocks
Have feedback on this article? Concerned about the content? Get in touch with us directly. Alternatively, email editorial-team (at) simplywallst.com.
This article by Simply Wall St is general in nature. We provide commentary based on historical data and analyst forecasts only using an unbiased methodology and our articles are not intended to be financial advice. It does not constitute a recommendation to buy or sell any stock, and does not take account of your objectives, or your financial situation. We aim to bring you long-term focused analysis driven by fundamental data. Note that our analysis may not factor in the latest price-sensitive company announcements or qualitative material. Simply Wall St has no position in any stocks mentioned.
About SEHK:6618
JD Health International
An investment holding company, engages in the operation of an online healthcare platform in the People’s Republic of China.
Flawless balance sheet with solid track record.
Market Insights

Advertisement
Community Narratives
WhiteCap Is Positioned To Profit Regardless Of Trump's Policy 
Fair Value CA$22.60|61.6% undervalued
ST
Equity Analyst and Writer
Microsoft's Evolution Will Drive Revenue to New Heights Fueled by AI
Fair Value US$360.00|28.3% overvalued
BR
Community Contributor
A CASE FOR USD$2.50 (CAD$3.44) BY 2028 (A 5-10 BAGGER)
Fair Value CA$3.44|87.8% undervalued
AG
Community Contributor