
Advertisement
- Hong Kong
- /
- Food and Staples Retail
- /
- SEHK:30
YNBY International (HKG:30) Might Have The Makings Of A Multi-Bagger
If you're not sure where to start when looking for the next multi-bagger, there are a few key trends you should keep an eye out for. Amongst other things, we'll want to see two things; firstly, a growing return on capital employed (ROCE) and secondly, an expansion in the company's amount of capital employed. Basically this means that a company has profitable initiatives that it can continue to reinvest in, which is a trait of a compounding machine. So on that note, YNBY International (HKG:30) looks quite promising in regards to its trends of return on capital.
Understanding Return On Capital Employed (ROCE)
Just to clarify if you're unsure, ROCE is a metric for evaluating how much pre-tax income (in percentage terms) a company earns on the capital invested in its business. To calculate this metric for YNBY International, this is the formula:
Return on Capital Employed = Earnings Before Interest and Tax (EBIT) ÷ (Total Assets - Current Liabilities)
0.073 = HK$19m ÷ (HK$390m - HK$135m) (Based on the trailing twelve months to December 2023).
Thus, YNBY International has an ROCE of 7.3%. Even though it's in line with the industry average of 7.3%, it's still a low return by itself.
View our latest analysis for YNBY International
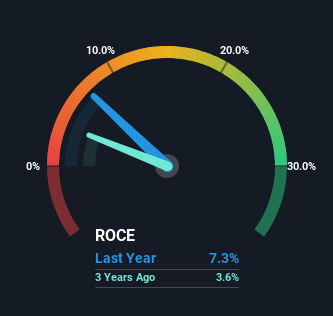
Historical performance is a great place to start when researching a stock so above you can see the gauge for YNBY International's ROCE against it's prior returns. If you want to delve into the historical earnings , check out these free graphs detailing revenue and cash flow performance of YNBY International.
What Can We Tell From YNBY International's ROCE Trend?
You'd find it hard not to be impressed with the ROCE trend at YNBY International. The data shows that returns on capital have increased by 61% over the trailing five years. That's a very favorable trend because this means that the company is earning more per dollar of capital that's being employed. Speaking of capital employed, the company is actually utilizing 67% less than it was five years ago, which can be indicative of a business that's improving its efficiency. YNBY International may be selling some assets so it's worth investigating if the business has plans for future investments to increase returns further still.
For the record though, there was a noticeable increase in the company's current liabilities over the period, so we would attribute some of the ROCE growth to that. The current liabilities has increased to 35% of total assets, so the business is now more funded by the likes of its suppliers or short-term creditors. It's worth keeping an eye on this because as the percentage of current liabilities to total assets increases, some aspects of risk also increase.
In Conclusion...
In summary, it's great to see that YNBY International has been able to turn things around and earn higher returns on lower amounts of capital. Although the company may be facing some issues elsewhere since the stock has plunged 70% in the last five years. Regardless, we think the underlying fundamentals warrant this stock for further investigation.
Like most companies, YNBY International does come with some risks, and we've found 3 warning signs that you should be aware of.
If you want to search for solid companies with great earnings, check out this free list of companies with good balance sheets and impressive returns on equity.
New: Manage All Your Stock Portfolios in One Place
We've created the ultimate portfolio companion for stock investors, and it's free.
• Connect an unlimited number of Portfolios and see your total in one currency
• Be alerted to new Warning Signs or Risks via email or mobile
• Track the Fair Value of your stocks
Have feedback on this article? Concerned about the content? Get in touch with us directly. Alternatively, email editorial-team (at) simplywallst.com.
This article by Simply Wall St is general in nature. We provide commentary based on historical data and analyst forecasts only using an unbiased methodology and our articles are not intended to be financial advice. It does not constitute a recommendation to buy or sell any stock, and does not take account of your objectives, or your financial situation. We aim to bring you long-term focused analysis driven by fundamental data. Note that our analysis may not factor in the latest price-sensitive company announcements or qualitative material. Simply Wall St has no position in any stocks mentioned.
About SEHK:30
YNBY International
An investment holding company, engages in the e-commerce trading business in Hong Kong, the People’s Republic of China, and internationally.
Flawless balance sheet with questionable track record.
Market Insights

Advertisement
Community Narratives
Groundbreaking therapies that could change the treatment landscape for PTSD, fibromyalgia, MS & Alzheimer’s
Fair Value US$6.20|86.9% undervalued
CM
Community Contributor
DigitalOcean Will Grow 14% by Embracing AI with Paperspace Acquisition
Fair Value US$50.00|41.7% undervalued
NE
Community Contributor
Viant Technology: A Rising AdTech Challenger in the AI-Powered CTV Market
Fair Value US$38.61|63.2% undervalued
BL
Community Contributor
Volvo will Accelerate Forward into Electric and Autonomous Leadership in Five Years
Fair Value SEK 438.80|39.7% undervalued
UN
Community Contributor