

If you're looking for a multi-bagger, there's a few things to keep an eye out for. Typically, we'll want to notice a trend of growing return on capital employed (ROCE) and alongside that, an expanding base of capital employed. Put simply, these types of businesses are compounding machines, meaning they are continually reinvesting their earnings at ever-higher rates of return. So on that note, YNBY International (HKG:30) looks quite promising in regards to its trends of return on capital.
Understanding Return On Capital Employed (ROCE)
For those that aren't sure what ROCE is, it measures the amount of pre-tax profits a company can generate from the capital employed in its business. The formula for this calculation on YNBY International is:
Return on Capital Employed = Earnings Before Interest and Tax (EBIT) ÷ (Total Assets - Current Liabilities)
0.10 = HK$27m ÷ (HK$368m - HK$100m) (Based on the trailing twelve months to December 2024).
Thus, YNBY International has an ROCE of 10.0%. On its own, that's a low figure but it's around the 8.7% average generated by the Consumer Retailing industry.
Check out our latest analysis for YNBY International
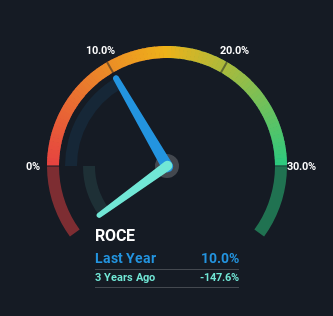
Historical performance is a great place to start when researching a stock so above you can see the gauge for YNBY International's ROCE against it's prior returns. If you're interested in investigating YNBY International's past further, check out this free graph covering YNBY International's past earnings, revenue and cash flow .
The Trend Of ROCE
YNBY International has not disappointed in regards to ROCE growth. We found that the returns on capital employed over the last five years have risen by 29%. The company is now earning HK$0.1 per dollar of capital employed. Speaking of capital employed, the company is actually utilizing 67% less than it was five years ago, which can be indicative of a business that's improving its efficiency. YNBY International may be selling some assets so it's worth investigating if the business has plans for future investments to increase returns further still.
On a side note, we noticed that the improvement in ROCE appears to be partly fueled by an increase in current liabilities. The current liabilities has increased to 27% of total assets, so the business is now more funded by the likes of its suppliers or short-term creditors. It's worth keeping an eye on this because as the percentage of current liabilities to total assets increases, some aspects of risk also increase.
The Key Takeaway
From what we've seen above, YNBY International has managed to increase it's returns on capital all the while reducing it's capital base. Astute investors may have an opportunity here because the stock has declined 46% in the last five years. So researching this company further and determining whether or not these trends will continue seems justified.
YNBY International does have some risks though, and we've spotted 1 warning sign for YNBY International that you might be interested in.
For those who like to invest in solid companies, check out this free list of companies with solid balance sheets and high returns on equity.
If you're looking to trade YNBY International, open an account with the lowest-cost platform trusted by professionals, Interactive Brokers.
With clients in over 200 countries and territories, and access to 160 markets, IBKR lets you trade stocks, options, futures, forex, bonds and funds from a single integrated account.
Enjoy no hidden fees, no account minimums, and FX conversion rates as low as 0.03%, far better than what most brokers offer.
Sponsored ContentNew: Manage All Your Stock Portfolios in One Place
We've created the ultimate portfolio companion for stock investors, and it's free.
• Connect an unlimited number of Portfolios and see your total in one currency
• Be alerted to new Warning Signs or Risks via email or mobile
• Track the Fair Value of your stocks
Have feedback on this article? Concerned about the content? Get in touch with us directly. Alternatively, email editorial-team (at) simplywallst.com.
This article by Simply Wall St is general in nature. We provide commentary based on historical data and analyst forecasts only using an unbiased methodology and our articles are not intended to be financial advice. It does not constitute a recommendation to buy or sell any stock, and does not take account of your objectives, or your financial situation. We aim to bring you long-term focused analysis driven by fundamental data. Note that our analysis may not factor in the latest price-sensitive company announcements or qualitative material. Simply Wall St has no position in any stocks mentioned.
About SEHK:30
YNBY International
An investment holding company, engages in the e-commerce trading business in Hong Kong, the People’s Republic of China, and internationally.
Flawless balance sheet with questionable track record.
Market Insights

Community Narratives

