What Greatime International Holdings Limited's (HKG:844) 50% Share Price Gain Is Not Telling You


Greatime International Holdings Limited (HKG:844) shares have had a really impressive month, gaining 50% after a shaky period beforehand. Not all shareholders will be feeling jubilant, since the share price is still down a very disappointing 26% in the last twelve months.
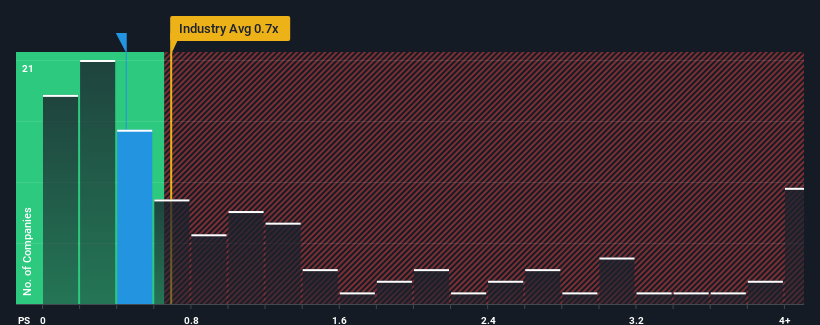
In spite of the firm bounce in price, there still wouldn't be many who think Greatime International Holdings' price-to-sales (or "P/S") ratio of 0.4x is worth a mention when the median P/S in Hong Kong's Luxury industry is similar at about 0.7x. Although, it's not wise to simply ignore the P/S without explanation as investors may be disregarding a distinct opportunity or a costly mistake.
See our latest analysis for Greatime International Holdings
How Has Greatime International Holdings Performed Recently?
Revenue has risen firmly for Greatime International Holdings recently, which is pleasing to see. Perhaps the market is expecting future revenue performance to only keep up with the broader industry, which has keeping the P/S in line with expectations. Those who are bullish on Greatime International Holdings will be hoping that this isn't the case, so that they can pick up the stock at a lower valuation.
Want the full picture on earnings, revenue and cash flow for the company? Then our free report on Greatime International Holdings will help you shine a light on its historical performance.What Are Revenue Growth Metrics Telling Us About The P/S?
The only time you'd be comfortable seeing a P/S like Greatime International Holdings' is when the company's growth is tracking the industry closely.
If we review the last year of revenue growth, the company posted a worthy increase of 8.4%. The solid recent performance means it was also able to grow revenue by 22% in total over the last three years. Therefore, it's fair to say the revenue growth recently has been respectable for the company.
Comparing that to the industry, which is predicted to deliver 13% growth in the next 12 months, the company's momentum is weaker, based on recent medium-term annualised revenue results.
With this in mind, we find it intriguing that Greatime International Holdings' P/S is comparable to that of its industry peers. Apparently many investors in the company are less bearish than recent times would indicate and aren't willing to let go of their stock right now. They may be setting themselves up for future disappointment if the P/S falls to levels more in line with recent growth rates.
The Bottom Line On Greatime International Holdings' P/S
Its shares have lifted substantially and now Greatime International Holdings' P/S is back within range of the industry median. Generally, our preference is to limit the use of the price-to-sales ratio to establishing what the market thinks about the overall health of a company.
Our examination of Greatime International Holdings revealed its poor three-year revenue trends aren't resulting in a lower P/S as per our expectations, given they look worse than current industry outlook. When we see weak revenue with slower than industry growth, we suspect the share price is at risk of declining, bringing the P/S back in line with expectations. If recent medium-term revenue trends continue, the probability of a share price decline will become quite substantial, placing shareholders at risk.
Plus, you should also learn about these 2 warning signs we've spotted with Greatime International Holdings (including 1 which is a bit concerning).
It's important to make sure you look for a great company, not just the first idea you come across. So if growing profitability aligns with your idea of a great company, take a peek at this free list of interesting companies with strong recent earnings growth (and a low P/E).
If you're looking to trade Greatime International Holdings, open an account with the lowest-cost platform trusted by professionals, Interactive Brokers.
With clients in over 200 countries and territories, and access to 160 markets, IBKR lets you trade stocks, options, futures, forex, bonds and funds from a single integrated account.
Enjoy no hidden fees, no account minimums, and FX conversion rates as low as 0.03%, far better than what most brokers offer.
Sponsored ContentNew: Manage All Your Stock Portfolios in One Place
We've created the ultimate portfolio companion for stock investors, and it's free.
• Connect an unlimited number of Portfolios and see your total in one currency
• Be alerted to new Warning Signs or Risks via email or mobile
• Track the Fair Value of your stocks
Have feedback on this article? Concerned about the content? Get in touch with us directly. Alternatively, email editorial-team (at) simplywallst.com.
This article by Simply Wall St is general in nature. We provide commentary based on historical data and analyst forecasts only using an unbiased methodology and our articles are not intended to be financial advice. It does not constitute a recommendation to buy or sell any stock, and does not take account of your objectives, or your financial situation. We aim to bring you long-term focused analysis driven by fundamental data. Note that our analysis may not factor in the latest price-sensitive company announcements or qualitative material. Simply Wall St has no position in any stocks mentioned.
About SEHK:844
Greatime International Holdings
An investment holding company, manufactures and sells innerwear products and knitted fabrics for infants and adults in the People’s Republic of China.
Excellent balance sheet low.
Market Insights

Community Narratives

