- Hong Kong
- /
- Consumer Durables
- /
- SEHK:6822
Are Investors Concerned With What's Going On At King's Flair International (Holdings) (HKG:6822)?


What financial metrics can indicate to us that a company is maturing or even in decline? Typically, we'll see the trend of both return on capital employed (ROCE) declining and this usually coincides with a decreasing amount of capital employed. This indicates to us that the business is not only shrinking the size of its net assets, but its returns are falling as well. So after we looked into King's Flair International (Holdings) (HKG:6822), the trends above didn't look too great.
Return On Capital Employed (ROCE): What is it?
For those that aren't sure what ROCE is, it measures the amount of pre-tax profits a company can generate from the capital employed in its business. The formula for this calculation on King's Flair International (Holdings) is:
Return on Capital Employed = Earnings Before Interest and Tax (EBIT) ÷ (Total Assets - Current Liabilities)
0.22 = HK$138m ÷ (HK$1.0b - HK$401m) (Based on the trailing twelve months to June 2020).
Therefore, King's Flair International (Holdings) has an ROCE of 22%. That's a fantastic return and not only that, it outpaces the average of 10% earned by companies in a similar industry.
View our latest analysis for King's Flair International (Holdings)
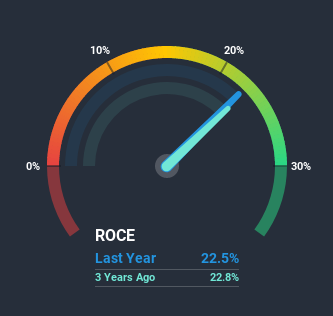
Historical performance is a great place to start when researching a stock so above you can see the gauge for King's Flair International (Holdings)'s ROCE against it's prior returns. If you'd like to look at how King's Flair International (Holdings) has performed in the past in other metrics, you can view this free graph of past earnings, revenue and cash flow.
How Are Returns Trending?
We are a bit worried about the trend of returns on capital at King's Flair International (Holdings). Unfortunately the returns on capital have diminished from the 30% that they were earning five years ago. Meanwhile, capital employed in the business has stayed roughly the flat over the period. Companies that exhibit these attributes tend to not be shrinking, but they can be mature and facing pressure on their margins from competition. So because these trends aren't typically conducive to creating a multi-bagger, we wouldn't hold our breath on King's Flair International (Holdings) becoming one if things continue as they have.
While on the subject, we noticed that the ratio of current liabilities to total assets has risen to 40%, which has impacted the ROCE. If current liabilities hadn't increased as much as they did, the ROCE could actually be even lower. While the ratio isn't currently too high, it's worth keeping an eye on this because if it gets particularly high, the business could then face some new elements of risk.The Key Takeaway
In summary, it's unfortunate that King's Flair International (Holdings) is generating lower returns from the same amount of capital. But investors must be expecting an improvement of sorts because over the last five yearsthe stock has delivered a respectable 85% return. In any case, the current underlying trends don't bode well for long term performance so unless they reverse, we'd start looking elsewhere.
If you'd like to know more about King's Flair International (Holdings), we've spotted 2 warning signs, and 1 of them is a bit concerning.
If you want to search for more stocks that have been earning high returns, check out this free list of stocks with solid balance sheets that are also earning high returns on equity.
If you’re looking to trade King's Flair International (Holdings), open an account with the lowest-cost* platform trusted by professionals, Interactive Brokers. Their clients from over 200 countries and territories trade stocks, options, futures, forex, bonds and funds worldwide from a single integrated account. Promoted
Valuation is complex, but we're here to simplify it.
Discover if King's Flair International (Holdings) might be undervalued or overvalued with our detailed analysis, featuring fair value estimates, potential risks, dividends, insider trades, and its financial condition.
Access Free AnalysisThis article by Simply Wall St is general in nature. It does not constitute a recommendation to buy or sell any stock, and does not take account of your objectives, or your financial situation. We aim to bring you long-term focused analysis driven by fundamental data. Note that our analysis may not factor in the latest price-sensitive company announcements or qualitative material. Simply Wall St has no position in any stocks mentioned.
*Interactive Brokers Rated Lowest Cost Broker by StockBrokers.com Annual Online Review 2020
Have feedback on this article? Concerned about the content? Get in touch with us directly. Alternatively, email editorial-team@simplywallst.com.
About SEHK:6822
King's Flair International (Holdings)
An investment holding company, provides kitchenware and household products in the United States, Europe, Asia, Canada, and internationally.
Adequate balance sheet low.
Market Insights

Community Narratives


