
Advertisement
- Hong Kong
- /
- Consumer Durables
- /
- SEHK:638
Some Investors May Be Worried About Kin Yat Holdings' (HKG:638) Returns On Capital

Did you know there are some financial metrics that can provide clues of a potential multi-bagger? Ideally, a business will show two trends; firstly a growing return on capital employed (ROCE) and secondly, an increasing amount of capital employed. If you see this, it typically means it's a company with a great business model and plenty of profitable reinvestment opportunities. Although, when we looked at Kin Yat Holdings (HKG:638), it didn't seem to tick all of these boxes.
Return On Capital Employed (ROCE): What is it?
For those who don't know, ROCE is a measure of a company's yearly pre-tax profit (its return), relative to the capital employed in the business. To calculate this metric for Kin Yat Holdings, this is the formula:
Return on Capital Employed = Earnings Before Interest and Tax (EBIT) ÷ (Total Assets - Current Liabilities)
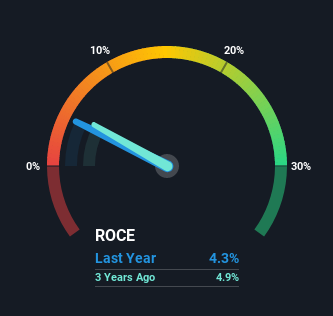
0.043 = HK$76m ÷ (HK$3.2b - HK$1.5b) (Based on the trailing twelve months to March 2021).
Thus, Kin Yat Holdings has an ROCE of 4.3%. Ultimately, that's a low return and it under-performs the Consumer Durables industry average of 11%.
See our latest analysis for Kin Yat Holdings
While the past is not representative of the future, it can be helpful to know how a company has performed historically, which is why we have this chart above. If you're interested in investigating Kin Yat Holdings' past further, check out this free graph of past earnings, revenue and cash flow.
So How Is Kin Yat Holdings' ROCE Trending?
In terms of Kin Yat Holdings' historical ROCE movements, the trend isn't fantastic. Over the last five years, returns on capital have decreased to 4.3% from 8.8% five years ago. And considering revenue has dropped while employing more capital, we'd be cautious. This could mean that the business is losing its competitive advantage or market share, because while more money is being put into ventures, it's actually producing a lower return - "less bang for their buck" per se.
Another thing to note, Kin Yat Holdings has a high ratio of current liabilities to total assets of 45%. This can bring about some risks because the company is basically operating with a rather large reliance on its suppliers or other sorts of short-term creditors. While it's not necessarily a bad thing, it can be beneficial if this ratio is lower.
The Key Takeaway
We're a bit apprehensive about Kin Yat Holdings because despite more capital being deployed in the business, returns on that capital and sales have both fallen. It should come as no surprise then that the stock has fallen 33% over the last five years, so it looks like investors are recognizing these changes. With underlying trends that aren't great in these areas, we'd consider looking elsewhere.
If you want to continue researching Kin Yat Holdings, you might be interested to know about the 4 warning signs that our analysis has discovered.
While Kin Yat Holdings isn't earning the highest return, check out this free list of companies that are earning high returns on equity with solid balance sheets.
When trading stocks or any other investment, use the platform considered by many to be the Professional's Gateway to the Worlds Market, Interactive Brokers. You get the lowest-cost* trading on stocks, options, futures, forex, bonds and funds worldwide from a single integrated account. Promoted
Valuation is complex, but we're here to simplify it.
Discover if Kin Yat Holdings might be undervalued or overvalued with our detailed analysis, featuring fair value estimates, potential risks, dividends, insider trades, and its financial condition.
Access Free AnalysisThis article by Simply Wall St is general in nature. We provide commentary based on historical data and analyst forecasts only using an unbiased methodology and our articles are not intended to be financial advice. It does not constitute a recommendation to buy or sell any stock, and does not take account of your objectives, or your financial situation. We aim to bring you long-term focused analysis driven by fundamental data. Note that our analysis may not factor in the latest price-sensitive company announcements or qualitative material. Simply Wall St has no position in any stocks mentioned.
*Interactive Brokers Rated Lowest Cost Broker by StockBrokers.com Annual Online Review 2020
Have feedback on this article? Concerned about the content? Get in touch with us directly. Alternatively, email editorial-team (at) simplywallst.com.
About SEHK:638
Kin Yat Holdings
An investment holding company, engages in the design, manufacture, sale, and trading of electrical and electronic products, motor drives, encoder film, and other products.
Adequate balance sheet and slightly overvalued.
Market Insights

Advertisement
Community Narratives
Groundbreaking therapies that could change the treatment landscape for PTSD, fibromyalgia, MS & Alzheimer’s
Fair Value US$6.20|86.9% undervalued
CM
Community Contributor
DigitalOcean Will Grow 14% by Embracing AI with Paperspace Acquisition
Fair Value US$50.00|41.7% undervalued
NE
Community Contributor
Viant Technology: A Rising AdTech Challenger in the AI-Powered CTV Market
Fair Value US$38.61|63.2% undervalued
BL
Community Contributor
Volvo will Accelerate Forward into Electric and Autonomous Leadership in Five Years
Fair Value SEK 438.80|37.1% undervalued
UN
Community Contributor