- Hong Kong
- /
- Consumer Durables
- /
- SEHK:531
The five-year shareholder returns and company earnings persist lower as Samson Holding (HKG:531) stock falls a further 12% in past week


We think intelligent long term investing is the way to go. But along the way some stocks are going to perform badly. For example, after five long years the Samson Holding Ltd. (HKG:531) share price is a whole 70% lower. We certainly feel for shareholders who bought near the top. We also note that the stock has performed poorly over the last year, with the share price down 37%.
With the stock having lost 12% in the past week, it's worth taking a look at business performance and seeing if there's any red flags.
See our latest analysis for Samson Holding
To paraphrase Benjamin Graham: Over the short term the market is a voting machine, but over the long term it's a weighing machine. One flawed but reasonable way to assess how sentiment around a company has changed is to compare the earnings per share (EPS) with the share price.
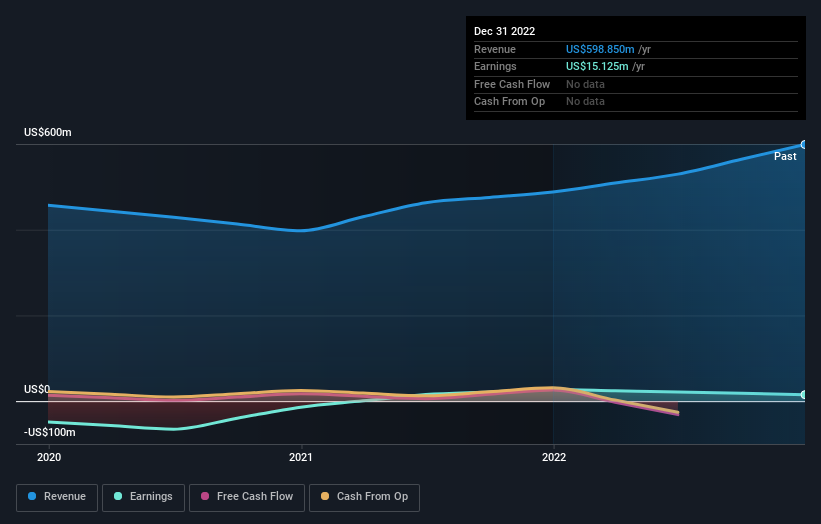
Samson Holding became profitable within the last five years. That would generally be considered a positive, so we are surprised to see the share price is down. Other metrics might give us a better handle on how its value is changing over time.
The most recent dividend was actually lower than it was in the past, so that may have sent the share price lower.
You can see how earnings and revenue have changed over time in the image below (click on the chart to see the exact values).
Take a more thorough look at Samson Holding's financial health with this free report on its balance sheet.
What About Dividends?
When looking at investment returns, it is important to consider the difference between total shareholder return (TSR) and share price return. The TSR incorporates the value of any spin-offs or discounted capital raisings, along with any dividends, based on the assumption that the dividends are reinvested. Arguably, the TSR gives a more comprehensive picture of the return generated by a stock. As it happens, Samson Holding's TSR for the last 5 years was -66%, which exceeds the share price return mentioned earlier. This is largely a result of its dividend payments!
A Different Perspective
We regret to report that Samson Holding shareholders are down 32% for the year (even including dividends). Unfortunately, that's worse than the broader market decline of 2.0%. However, it could simply be that the share price has been impacted by broader market jitters. It might be worth keeping an eye on the fundamentals, in case there's a good opportunity. Unfortunately, last year's performance may indicate unresolved challenges, given that it was worse than the annualised loss of 11% over the last half decade. We realise that Baron Rothschild has said investors should "buy when there is blood on the streets", but we caution that investors should first be sure they are buying a high quality business. While it is well worth considering the different impacts that market conditions can have on the share price, there are other factors that are even more important. Case in point: We've spotted 3 warning signs for Samson Holding you should be aware of, and 1 of them is a bit concerning.
If you would prefer to check out another company -- one with potentially superior financials -- then do not miss this free list of companies that have proven they can grow earnings.
Please note, the market returns quoted in this article reflect the market weighted average returns of stocks that currently trade on Hong Kong exchanges.
New: Manage All Your Stock Portfolios in One Place
We've created the ultimate portfolio companion for stock investors, and it's free.
• Connect an unlimited number of Portfolios and see your total in one currency
• Be alerted to new Warning Signs or Risks via email or mobile
• Track the Fair Value of your stocks
Have feedback on this article? Concerned about the content? Get in touch with us directly. Alternatively, email editorial-team (at) simplywallst.com.
This article by Simply Wall St is general in nature. We provide commentary based on historical data and analyst forecasts only using an unbiased methodology and our articles are not intended to be financial advice. It does not constitute a recommendation to buy or sell any stock, and does not take account of your objectives, or your financial situation. We aim to bring you long-term focused analysis driven by fundamental data. Note that our analysis may not factor in the latest price-sensitive company announcements or qualitative material. Simply Wall St has no position in any stocks mentioned.
About SEHK:531
Samson Holding
An investment holding company, designs, manufactures, markets, trades in, and sells residential and commercial furniture in the People’s Republic of China, the United States, and internationally.
Excellent balance sheet and slightly overvalued.
Market Insights

Community Narratives

