
Advertisement

The external fund manager backed by Berkshire Hathaway's Charlie Munger, Li Lu, makes no bones about it when he says 'The biggest investment risk is not the volatility of prices, but whether you will suffer a permanent loss of capital.' When we think about how risky a company is, we always like to look at its use of debt, since debt overload can lead to ruin. We can see that Samson Holding Ltd. (HKG:531) does use debt in its business. But the more important question is: how much risk is that debt creating?
Why Does Debt Bring Risk?
Debt and other liabilities become risky for a business when it cannot easily fulfill those obligations, either with free cash flow or by raising capital at an attractive price. If things get really bad, the lenders can take control of the business. However, a more usual (but still expensive) situation is where a company must dilute shareholders at a cheap share price simply to get debt under control. Of course, plenty of companies use debt to fund growth, without any negative consequences. When we examine debt levels, we first consider both cash and debt levels, together.
View our latest analysis for Samson Holding
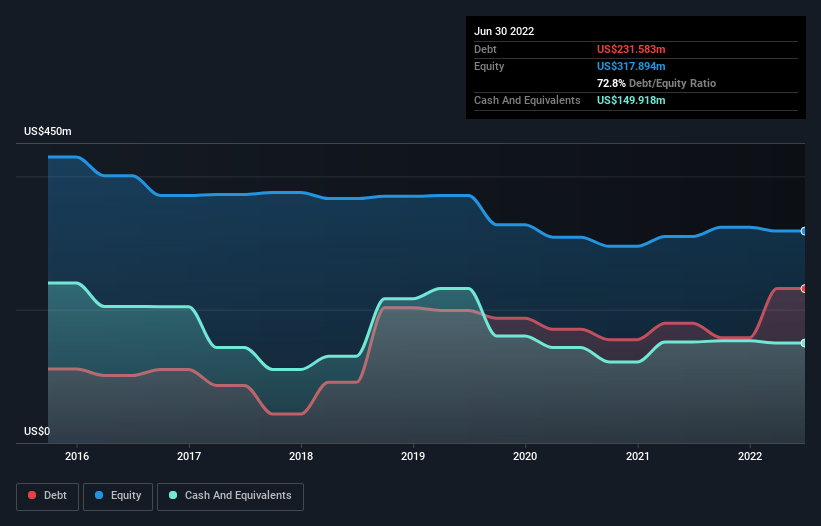
How Much Debt Does Samson Holding Carry?
The image below, which you can click on for greater detail, shows that at June 2022 Samson Holding had debt of US$231.6m, up from US$179.7m in one year. However, it also had US$149.9m in cash, and so its net debt is US$81.7m.
How Healthy Is Samson Holding's Balance Sheet?
The latest balance sheet data shows that Samson Holding had liabilities of US$260.2m due within a year, and liabilities of US$107.3m falling due after that. Offsetting these obligations, it had cash of US$149.9m as well as receivables valued at US$135.3m due within 12 months. So its liabilities outweigh the sum of its cash and (near-term) receivables by US$82.3m.
While this might seem like a lot, it is not so bad since Samson Holding has a market capitalization of US$154.8m, and so it could probably strengthen its balance sheet by raising capital if it needed to. However, it is still worthwhile taking a close look at its ability to pay off debt.
We use two main ratios to inform us about debt levels relative to earnings. The first is net debt divided by earnings before interest, tax, depreciation, and amortization (EBITDA), while the second is how many times its earnings before interest and tax (EBIT) covers its interest expense (or its interest cover, for short). Thus we consider debt relative to earnings both with and without depreciation and amortization expenses.
Samson Holding has a debt to EBITDA ratio of 3.7 and its EBIT covered its interest expense 6.4 times. Taken together this implies that, while we wouldn't want to see debt levels rise, we think it can handle its current leverage. Importantly, Samson Holding grew its EBIT by 73% over the last twelve months, and that growth will make it easier to handle its debt. There's no doubt that we learn most about debt from the balance sheet. But you can't view debt in total isolation; since Samson Holding will need earnings to service that debt. So when considering debt, it's definitely worth looking at the earnings trend. Click here for an interactive snapshot.
Finally, a company can only pay off debt with cold hard cash, not accounting profits. So it's worth checking how much of that EBIT is backed by free cash flow. Happily for any shareholders, Samson Holding actually produced more free cash flow than EBIT over the last two years. That sort of strong cash conversion gets us as excited as the crowd when the beat drops at a Daft Punk concert.
Our View
Happily, Samson Holding's impressive conversion of EBIT to free cash flow implies it has the upper hand on its debt. But, on a more sombre note, we are a little concerned by its net debt to EBITDA. When we consider the range of factors above, it looks like Samson Holding is pretty sensible with its use of debt. While that brings some risk, it can also enhance returns for shareholders. The balance sheet is clearly the area to focus on when you are analysing debt. However, not all investment risk resides within the balance sheet - far from it. For example, we've discovered 3 warning signs for Samson Holding (1 is a bit unpleasant!) that you should be aware of before investing here.
Of course, if you're the type of investor who prefers buying stocks without the burden of debt, then don't hesitate to discover our exclusive list of net cash growth stocks, today.
New: Manage All Your Stock Portfolios in One Place
We've created the ultimate portfolio companion for stock investors, and it's free.
• Connect an unlimited number of Portfolios and see your total in one currency
• Be alerted to new Warning Signs or Risks via email or mobile
• Track the Fair Value of your stocks
Have feedback on this article? Concerned about the content? Get in touch with us directly. Alternatively, email editorial-team (at) simplywallst.com.
This article by Simply Wall St is general in nature. We provide commentary based on historical data and analyst forecasts only using an unbiased methodology and our articles are not intended to be financial advice. It does not constitute a recommendation to buy or sell any stock, and does not take account of your objectives, or your financial situation. We aim to bring you long-term focused analysis driven by fundamental data. Note that our analysis may not factor in the latest price-sensitive company announcements or qualitative material. Simply Wall St has no position in any stocks mentioned.
About SEHK:531
Samson Holding
An investment holding company, designs, manufactures, markets, trades in, and sells residential and commercial furniture in the People’s Republic of China, the United States, and internationally.
Excellent balance sheet and slightly overvalued.
Market Insights

Advertisement
Community Narratives
Groundbreaking therapies that could change the treatment landscape for PTSD, fibromyalgia, MS & Alzheimer’s
Fair Value US$6.20|86.9% undervalued
CM
Community Contributor
DigitalOcean Will Grow 14% by Embracing AI with Paperspace Acquisition
Fair Value US$50.00|41.7% undervalued
NE
Community Contributor
Viant Technology: A Rising AdTech Challenger in the AI-Powered CTV Market
Fair Value US$38.61|63.2% undervalued
BL
Community Contributor
Volvo will Accelerate Forward into Electric and Autonomous Leadership in Five Years
Fair Value SEK 438.80|39.7% undervalued
UN
Community Contributor