
Advertisement

Howard Marks put it nicely when he said that, rather than worrying about share price volatility, 'The possibility of permanent loss is the risk I worry about... and every practical investor I know worries about.' It's only natural to consider a company's balance sheet when you examine how risky it is, since debt is often involved when a business collapses. As with many other companies Samson Holding Ltd. (HKG:531) makes use of debt. But should shareholders be worried about its use of debt?
When Is Debt A Problem?
Debt and other liabilities become risky for a business when it cannot easily fulfill those obligations, either with free cash flow or by raising capital at an attractive price. In the worst case scenario, a company can go bankrupt if it cannot pay its creditors. However, a more common (but still painful) scenario is that it has to raise new equity capital at a low price, thus permanently diluting shareholders. Of course, plenty of companies use debt to fund growth, without any negative consequences. When we examine debt levels, we first consider both cash and debt levels, together.
Check out our latest analysis for Samson Holding
What Is Samson Holding's Debt?
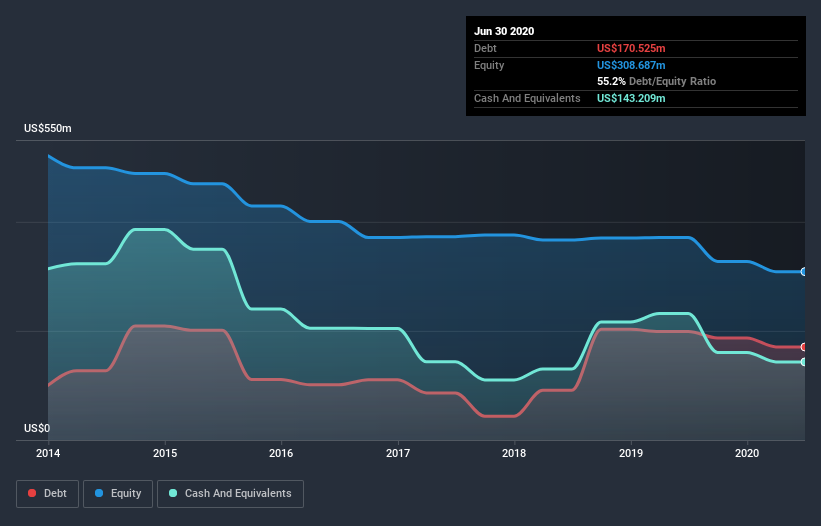
The image below, which you can click on for greater detail, shows that Samson Holding had debt of US$170.5m at the end of June 2020, a reduction from US$198.9m over a year. On the flip side, it has US$143.2m in cash leading to net debt of about US$27.3m.
How Healthy Is Samson Holding's Balance Sheet?
The latest balance sheet data shows that Samson Holding had liabilities of US$228.3m due within a year, and liabilities of US$64.8m falling due after that. On the other hand, it had cash of US$143.2m and US$86.6m worth of receivables due within a year. So its liabilities outweigh the sum of its cash and (near-term) receivables by US$63.2m.
This deficit is considerable relative to its market capitalization of US$97.0m, so it does suggest shareholders should keep an eye on Samson Holding's use of debt. This suggests shareholders would be heavily diluted if the company needed to shore up its balance sheet in a hurry. When analysing debt levels, the balance sheet is the obvious place to start. But you can't view debt in total isolation; since Samson Holding will need earnings to service that debt. So if you're keen to discover more about its earnings, it might be worth checking out this graph of its long term earnings trend.
In the last year Samson Holding had a loss before interest and tax, and actually shrunk its revenue by 5.0%, to US$429m. We would much prefer see growth.
Caveat Emptor
Importantly, Samson Holding had an earnings before interest and tax (EBIT) loss over the last year. Indeed, it lost a very considerable US$28m at the EBIT level. When we look at that and recall the liabilities on its balance sheet, relative to cash, it seems unwise to us for the company to have any debt. Quite frankly we think the balance sheet is far from match-fit, although it could be improved with time. For example, we would not want to see a repeat of last year's loss of US$65m. So to be blunt we do think it is risky. There's no doubt that we learn most about debt from the balance sheet. But ultimately, every company can contain risks that exist outside of the balance sheet. To that end, you should learn about the 3 warning signs we've spotted with Samson Holding (including 2 which is are concerning) .
At the end of the day, it's often better to focus on companies that are free from net debt. You can access our special list of such companies (all with a track record of profit growth). It's free.
When trading Samson Holding or any other investment, use the platform considered by many to be the Professional's Gateway to the Worlds Market, Interactive Brokers. You get the lowest-cost* trading on stocks, options, futures, forex, bonds and funds worldwide from a single integrated account. Promoted
New: Manage All Your Stock Portfolios in One Place
We've created the ultimate portfolio companion for stock investors, and it's free.
• Connect an unlimited number of Portfolios and see your total in one currency
• Be alerted to new Warning Signs or Risks via email or mobile
• Track the Fair Value of your stocks
This article by Simply Wall St is general in nature. It does not constitute a recommendation to buy or sell any stock, and does not take account of your objectives, or your financial situation. We aim to bring you long-term focused analysis driven by fundamental data. Note that our analysis may not factor in the latest price-sensitive company announcements or qualitative material. Simply Wall St has no position in any stocks mentioned.
*Interactive Brokers Rated Lowest Cost Broker by StockBrokers.com Annual Online Review 2020
Have feedback on this article? Concerned about the content? Get in touch with us directly. Alternatively, email editorial-team@simplywallst.com.
About SEHK:531
Samson Holding
An investment holding company, designs, manufactures, markets, trades in, and sells residential and commercial furniture in the People’s Republic of China, the United States, and internationally.
Excellent balance sheet and slightly overvalued.
Market Insights

Advertisement
Community Narratives
Groundbreaking therapies that could change the treatment landscape for PTSD, fibromyalgia, MS & Alzheimer’s
Fair Value US$6.20|86.9% undervalued
CM
Community Contributor
DigitalOcean Will Grow 14% by Embracing AI with Paperspace Acquisition
Fair Value US$50.00|41.7% undervalued
NE
Community Contributor
Viant Technology: A Rising AdTech Challenger in the AI-Powered CTV Market
Fair Value US$38.61|63.2% undervalued
BL
Community Contributor
Volvo will Accelerate Forward into Electric and Autonomous Leadership in Five Years
Fair Value SEK 438.80|39.7% undervalued
UN
Community Contributor