
Advertisement
- Hong Kong
- /
- Consumer Durables
- /
- SEHK:526
Revenues Not Telling The Story For Lisi Group (Holdings) Limited (HKG:526) After Shares Rise 26%
Lisi Group (Holdings) Limited (HKG:526) shares have continued their recent momentum with a 26% gain in the last month alone. The last 30 days bring the annual gain to a very sharp 79%.
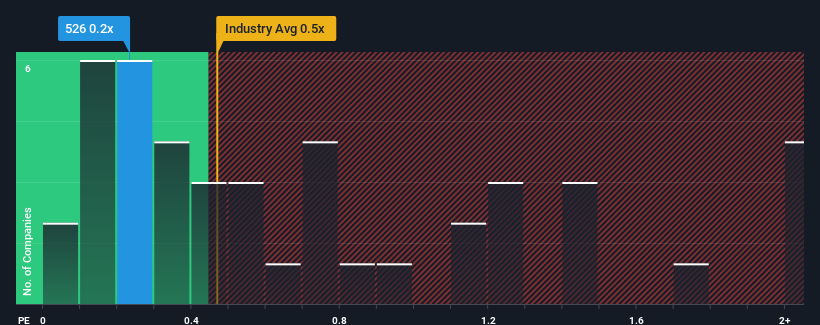
Although its price has surged higher, it's still not a stretch to say that Lisi Group (Holdings)'s price-to-sales (or "P/S") ratio of 0.2x right now seems quite "middle-of-the-road" compared to the Consumer Durables industry in Hong Kong, where the median P/S ratio is around 0.5x. However, investors might be overlooking a clear opportunity or potential setback if there is no rational basis for the P/S.
Check out our latest analysis for Lisi Group (Holdings)
How Lisi Group (Holdings) Has Been Performing
Lisi Group (Holdings) has been doing a decent job lately as it's been growing revenue at a reasonable pace. One possibility is that the P/S is moderate because investors think this good revenue growth might only be parallel to the broader industry in the near future. If not, then at least existing shareholders probably aren't too pessimistic about the future direction of the share price.
Want the full picture on earnings, revenue and cash flow for the company? Then our free report on Lisi Group (Holdings) will help you shine a light on its historical performance.Is There Some Revenue Growth Forecasted For Lisi Group (Holdings)?
There's an inherent assumption that a company should be matching the industry for P/S ratios like Lisi Group (Holdings)'s to be considered reasonable.
Retrospectively, the last year delivered a decent 3.7% gain to the company's revenues. Still, revenue has barely risen at all in aggregate from three years ago, which is not ideal. Accordingly, shareholders probably wouldn't have been overly satisfied with the unstable medium-term growth rates.
Comparing that to the industry, which is predicted to deliver 12% growth in the next 12 months, the company's momentum is weaker, based on recent medium-term annualised revenue results.
With this information, we find it interesting that Lisi Group (Holdings) is trading at a fairly similar P/S compared to the industry. It seems most investors are ignoring the fairly limited recent growth rates and are willing to pay up for exposure to the stock. They may be setting themselves up for future disappointment if the P/S falls to levels more in line with recent growth rates.
The Final Word
Lisi Group (Holdings) appears to be back in favour with a solid price jump bringing its P/S back in line with other companies in the industry Typically, we'd caution against reading too much into price-to-sales ratios when settling on investment decisions, though it can reveal plenty about what other market participants think about the company.
Our examination of Lisi Group (Holdings) revealed its poor three-year revenue trends aren't resulting in a lower P/S as per our expectations, given they look worse than current industry outlook. When we see weak revenue with slower than industry growth, we suspect the share price is at risk of declining, bringing the P/S back in line with expectations. If recent medium-term revenue trends continue, the probability of a share price decline will become quite substantial, placing shareholders at risk.
You should always think about risks. Case in point, we've spotted 3 warning signs for Lisi Group (Holdings) you should be aware of, and 2 of them are potentially serious.
It's important to make sure you look for a great company, not just the first idea you come across. So if growing profitability aligns with your idea of a great company, take a peek at this free list of interesting companies with strong recent earnings growth (and a low P/E).
New: AI Stock Screener & Alerts
Our new AI Stock Screener scans the market every day to uncover opportunities.
• Dividend Powerhouses (3%+ Yield)
• Undervalued Small Caps with Insider Buying
• High growth Tech and AI Companies
Or build your own from over 50 metrics.
Have feedback on this article? Concerned about the content? Get in touch with us directly. Alternatively, email editorial-team (at) simplywallst.com.
This article by Simply Wall St is general in nature. We provide commentary based on historical data and analyst forecasts only using an unbiased methodology and our articles are not intended to be financial advice. It does not constitute a recommendation to buy or sell any stock, and does not take account of your objectives, or your financial situation. We aim to bring you long-term focused analysis driven by fundamental data. Note that our analysis may not factor in the latest price-sensitive company announcements or qualitative material. Simply Wall St has no position in any stocks mentioned.
About SEHK:526
Lisi Group (Holdings)
An investment holding company, manufactures and trades in plastic and metallic household products in Mainland China, Hong Kong, the United States, Europe, and internationally.
Flawless balance sheet with low risk.
Similar Companies
Market Insights

Advertisement
Community Narratives
MINISO's fair value is projected at 26.69 with an anticipated PE ratio shift of 20x
Fair Value US$24.03|11.0% undervalued
BE
Community Contributor
Procter & Gamble: A Dividend Giant Facing Slowing Growth
Fair Value US$119.81|23.3% overvalued
AN
Community Contributor
Eli Lilly's Future Growth Driven by Tirzepatide and Favorable Market Conditions
Fair Value US$1.19k|13.8% undervalued
EA
Community Contributor