YGM Trading Limited (HKG:375) Investors Are Less Pessimistic Than Expected


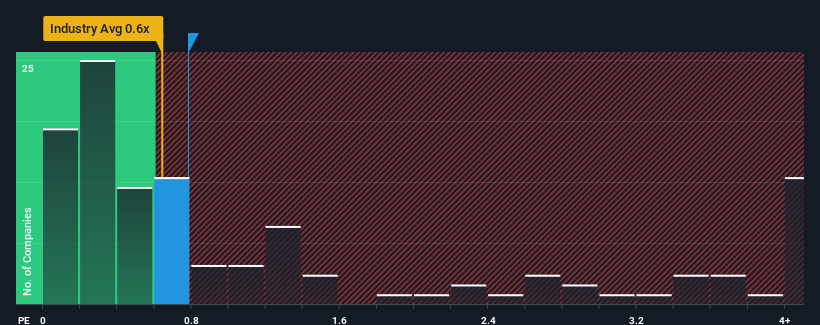
With a median price-to-sales (or "P/S") ratio of close to 0.6x in the Luxury industry in Hong Kong, you could be forgiven for feeling indifferent about YGM Trading Limited's (HKG:375) P/S ratio of 0.8x. While this might not raise any eyebrows, if the P/S ratio is not justified investors could be missing out on a potential opportunity or ignoring looming disappointment.
See our latest analysis for YGM Trading
What Does YGM Trading's P/S Mean For Shareholders?
YGM Trading has been doing a good job lately as it's been growing revenue at a solid pace. Perhaps the market is expecting future revenue performance to only keep up with the broader industry, which has keeping the P/S in line with expectations. If you like the company, you'd be hoping this isn't the case so that you could potentially pick up some stock while it's not quite in favour.
We don't have analyst forecasts, but you can see how recent trends are setting up the company for the future by checking out our free report on YGM Trading's earnings, revenue and cash flow.Is There Some Revenue Growth Forecasted For YGM Trading?
In order to justify its P/S ratio, YGM Trading would need to produce growth that's similar to the industry.
Retrospectively, the last year delivered an exceptional 19% gain to the company's top line. Revenue has also lifted 6.4% in aggregate from three years ago, mostly thanks to the last 12 months of growth. Therefore, it's fair to say the revenue growth recently has been respectable for the company.
This is in contrast to the rest of the industry, which is expected to grow by 12% over the next year, materially higher than the company's recent medium-term annualised growth rates.
With this information, we find it interesting that YGM Trading is trading at a fairly similar P/S compared to the industry. It seems most investors are ignoring the fairly limited recent growth rates and are willing to pay up for exposure to the stock. They may be setting themselves up for future disappointment if the P/S falls to levels more in line with recent growth rates.
What Does YGM Trading's P/S Mean For Investors?
Generally, our preference is to limit the use of the price-to-sales ratio to establishing what the market thinks about the overall health of a company.
We've established that YGM Trading's average P/S is a bit surprising since its recent three-year growth is lower than the wider industry forecast. Right now we are uncomfortable with the P/S as this revenue performance isn't likely to support a more positive sentiment for long. Unless there is a significant improvement in the company's medium-term performance, it will be difficult to prevent the P/S ratio from declining to a more reasonable level.
Before you take the next step, you should know about the 4 warning signs for YGM Trading (1 is a bit concerning!) that we have uncovered.
If these risks are making you reconsider your opinion on YGM Trading, explore our interactive list of high quality stocks to get an idea of what else is out there.
New: Manage All Your Stock Portfolios in One Place
We've created the ultimate portfolio companion for stock investors, and it's free.
• Connect an unlimited number of Portfolios and see your total in one currency
• Be alerted to new Warning Signs or Risks via email or mobile
• Track the Fair Value of your stocks
Have feedback on this article? Concerned about the content? Get in touch with us directly. Alternatively, email editorial-team (at) simplywallst.com.
This article by Simply Wall St is general in nature. We provide commentary based on historical data and analyst forecasts only using an unbiased methodology and our articles are not intended to be financial advice. It does not constitute a recommendation to buy or sell any stock, and does not take account of your objectives, or your financial situation. We aim to bring you long-term focused analysis driven by fundamental data. Note that our analysis may not factor in the latest price-sensitive company announcements or qualitative material. Simply Wall St has no position in any stocks mentioned.
About SEHK:375
YGM Trading
An investment holding company, engages in the wholesale and retail of garments in Hong Kong, Taiwan, Mainland China, the United Kingdom, and internationally.
Flawless balance sheet slight.
Market Insights

Community Narratives

