
Advertisement
Returns On Capital At Best Pacific International Holdings (HKG:2111) Have Hit The Brakes

To find a multi-bagger stock, what are the underlying trends we should look for in a business? Firstly, we'll want to see a proven return on capital employed (ROCE) that is increasing, and secondly, an expanding base of capital employed. If you see this, it typically means it's a company with a great business model and plenty of profitable reinvestment opportunities. In light of that, when we looked at Best Pacific International Holdings (HKG:2111) and its ROCE trend, we weren't exactly thrilled.
Return On Capital Employed (ROCE): What Is It?
For those that aren't sure what ROCE is, it measures the amount of pre-tax profits a company can generate from the capital employed in its business. To calculate this metric for Best Pacific International Holdings, this is the formula:
Return on Capital Employed = Earnings Before Interest and Tax (EBIT) ÷ (Total Assets - Current Liabilities)
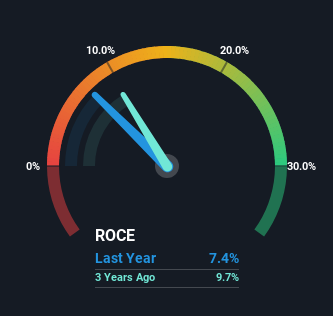
0.074 = HK$268m ÷ (HK$5.8b - HK$2.2b) (Based on the trailing twelve months to June 2023).
Thus, Best Pacific International Holdings has an ROCE of 7.4%. Ultimately, that's a low return and it under-performs the Luxury industry average of 11%.
See our latest analysis for Best Pacific International Holdings
In the above chart we have measured Best Pacific International Holdings' prior ROCE against its prior performance, but the future is arguably more important. If you'd like to see what analysts are forecasting going forward, you should check out our free report for Best Pacific International Holdings.
What Can We Tell From Best Pacific International Holdings' ROCE Trend?
There hasn't been much to report for Best Pacific International Holdings' returns and its level of capital employed because both metrics have been steady for the past five years. Businesses with these traits tend to be mature and steady operations because they're past the growth phase. With that in mind, unless investment picks up again in the future, we wouldn't expect Best Pacific International Holdings to be a multi-bagger going forward. With fewer investment opportunities, it makes sense that Best Pacific International Holdings has been paying out a decent 40% of its earnings to shareholders. Unless businesses have highly compelling growth opportunities, they'll typically return some money to shareholders.
On another note, while the change in ROCE trend might not scream for attention, it's interesting that the current liabilities have actually gone up over the last five years. This is intriguing because if current liabilities hadn't increased to 37% of total assets, this reported ROCE would probably be less than7.4% because total capital employed would be higher.The 7.4% ROCE could be even lower if current liabilities weren't 37% of total assets, because the the formula would show a larger base of total capital employed. So while current liabilities isn't high right now, keep an eye out in case it increases further, because this can introduce some elements of risk.
In Conclusion...
We can conclude that in regards to Best Pacific International Holdings' returns on capital employed and the trends, there isn't much change to report on. And investors appear hesitant that the trends will pick up because the stock has fallen 27% in the last five years. On the whole, we aren't too inspired by the underlying trends and we think there may be better chances of finding a multi-bagger elsewhere.
Best Pacific International Holdings does have some risks though, and we've spotted 1 warning sign for Best Pacific International Holdings that you might be interested in.
If you want to search for solid companies with great earnings, check out this free list of companies with good balance sheets and impressive returns on equity.
Valuation is complex, but we're here to simplify it.
Discover if Best Pacific International Holdings might be undervalued or overvalued with our detailed analysis, featuring fair value estimates, potential risks, dividends, insider trades, and its financial condition.
Access Free AnalysisHave feedback on this article? Concerned about the content? Get in touch with us directly. Alternatively, email editorial-team (at) simplywallst.com.
This article by Simply Wall St is general in nature. We provide commentary based on historical data and analyst forecasts only using an unbiased methodology and our articles are not intended to be financial advice. It does not constitute a recommendation to buy or sell any stock, and does not take account of your objectives, or your financial situation. We aim to bring you long-term focused analysis driven by fundamental data. Note that our analysis may not factor in the latest price-sensitive company announcements or qualitative material. Simply Wall St has no position in any stocks mentioned.
About SEHK:2111
Best Pacific International Holdings
Manufactures, trades in, and sells elastic fabric, elastic webbing, and lace.
Flawless balance sheet, undervalued and pays a dividend.
Market Insights

Advertisement
Community Narratives
Groundbreaking therapies that could change the treatment landscape for PTSD, fibromyalgia, MS & Alzheimer’s
Fair Value US$6.20|86.9% undervalued
CM
Community Contributor
DigitalOcean Will Grow 14% by Embracing AI with Paperspace Acquisition
Fair Value US$50.00|42.8% undervalued
NE
Community Contributor
Viant Technology: A Rising AdTech Challenger in the AI-Powered CTV Market
Fair Value US$38.61|66.0% undervalued
BL
Community Contributor
Volvo will Accelerate Forward into Electric and Autonomous Leadership in Five Years
Fair Value SEK 438.80|40.8% undervalued
UN
Community Contributor