
Advertisement
Key Insights
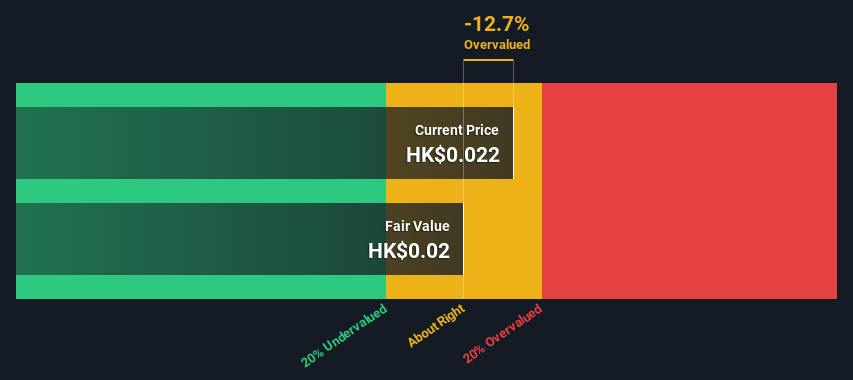
- CMON's estimated fair value is HK$0.02 based on 2 Stage Free Cash Flow to Equity
- With HK$0.022 share price, CMON appears to be trading close to its estimated fair value
- When compared to theindustry average discount of -4.6%, CMON's competitors seem to be trading at a lesser premium to fair value
How far off is CMON Limited (HKG:1792) from its intrinsic value? Using the most recent financial data, we'll take a look at whether the stock is fairly priced by estimating the company's future cash flows and discounting them to their present value. We will take advantage of the Discounted Cash Flow (DCF) model for this purpose. There's really not all that much to it, even though it might appear quite complex.
Companies can be valued in a lot of ways, so we would point out that a DCF is not perfect for every situation. If you want to learn more about discounted cash flow, the rationale behind this calculation can be read in detail in the Simply Wall St analysis model.
See our latest analysis for CMON
The Method
We're using the 2-stage growth model, which simply means we take in account two stages of company's growth. In the initial period the company may have a higher growth rate and the second stage is usually assumed to have a stable growth rate. To start off with, we need to estimate the next ten years of cash flows. Seeing as no analyst estimates of free cash flow are available to us, we have extrapolate the previous free cash flow (FCF) from the company's last reported value. We assume companies with shrinking free cash flow will slow their rate of shrinkage, and that companies with growing free cash flow will see their growth rate slow, over this period. We do this to reflect that growth tends to slow more in the early years than it does in later years.
Generally we assume that a dollar today is more valuable than a dollar in the future, so we need to discount the sum of these future cash flows to arrive at a present value estimate:
10-year free cash flow (FCF) forecast
| 2024 | 2025 | 2026 | 2027 | 2028 | 2029 | 2030 | 2031 | 2032 | 2033 | |
| Levered FCF ($, Millions) | US$1.11m | US$732.3k | US$563.0k | US$475.2k | US$426.2k | US$397.9k | US$381.8k | US$373.2k | US$369.5k | US$369.2k |
| Growth Rate Estimate Source | Est @ -49.23% | Est @ -33.87% | Est @ -23.12% | Est @ -15.59% | Est @ -10.32% | Est @ -6.64% | Est @ -4.05% | Est @ -2.25% | Est @ -0.98% | Est @ -0.10% |
| Present Value ($, Millions) Discounted @ 12% | US$1.0 | US$0.6 | US$0.4 | US$0.3 | US$0.2 | US$0.2 | US$0.2 | US$0.2 | US$0.1 | US$0.1 |
("Est" = FCF growth rate estimated by Simply Wall St)
Present Value of 10-year Cash Flow (PVCF) = US$3.3m
The second stage is also known as Terminal Value, this is the business's cash flow after the first stage. For a number of reasons a very conservative growth rate is used that cannot exceed that of a country's GDP growth. In this case we have used the 5-year average of the 10-year government bond yield (2.0%) to estimate future growth. In the same way as with the 10-year 'growth' period, we discount future cash flows to today's value, using a cost of equity of 12%.
Terminal Value (TV)= FCF2033 × (1 + g) ÷ (r – g) = US$369k× (1 + 2.0%) ÷ (12%– 2.0%) = US$3.8m
Present Value of Terminal Value (PVTV)= TV / (1 + r)10= US$3.8m÷ ( 1 + 12%)10= US$1.2m
The total value, or equity value, is then the sum of the present value of the future cash flows, which in this case is US$4.5m. In the final step we divide the equity value by the number of shares outstanding. Compared to the current share price of HK$0.02, the company appears around fair value at the time of writing. Valuations are imprecise instruments though, rather like a telescope - move a few degrees and end up in a different galaxy. Do keep this in mind.
The Assumptions
We would point out that the most important inputs to a discounted cash flow are the discount rate and of course the actual cash flows. If you don't agree with these result, have a go at the calculation yourself and play with the assumptions. The DCF also does not consider the possible cyclicality of an industry, or a company's future capital requirements, so it does not give a full picture of a company's potential performance. Given that we are looking at CMON as potential shareholders, the cost of equity is used as the discount rate, rather than the cost of capital (or weighted average cost of capital, WACC) which accounts for debt. In this calculation we've used 12%, which is based on a levered beta of 2.000. Beta is a measure of a stock's volatility, compared to the market as a whole. We get our beta from the industry average beta of globally comparable companies, with an imposed limit between 0.8 and 2.0, which is a reasonable range for a stable business.
Looking Ahead:
Whilst important, the DCF calculation shouldn't be the only metric you look at when researching a company. It's not possible to obtain a foolproof valuation with a DCF model. Preferably you'd apply different cases and assumptions and see how they would impact the company's valuation. If a company grows at a different rate, or if its cost of equity or risk free rate changes sharply, the output can look very different. For CMON, we've put together three fundamental elements you should further examine:
- Risks: Be aware that CMON is showing 3 warning signs in our investment analysis , and 2 of those can't be ignored...
- Other Solid Businesses: Low debt, high returns on equity and good past performance are fundamental to a strong business. Why not explore our interactive list of stocks with solid business fundamentals to see if there are other companies you may not have considered!
- Other Environmentally-Friendly Companies: Concerned about the environment and think consumers will buy eco-friendly products more and more? Browse through our interactive list of companies that are thinking about a greener future to discover some stocks you may not have thought of!
PS. The Simply Wall St app conducts a discounted cash flow valuation for every stock on the SEHK every day. If you want to find the calculation for other stocks just search here.
New: AI Stock Screener & Alerts
Our new AI Stock Screener scans the market every day to uncover opportunities.
• Dividend Powerhouses (3%+ Yield)
• Undervalued Small Caps with Insider Buying
• High growth Tech and AI Companies
Or build your own from over 50 metrics.
Have feedback on this article? Concerned about the content? Get in touch with us directly. Alternatively, email editorial-team (at) simplywallst.com.
This article by Simply Wall St is general in nature. We provide commentary based on historical data and analyst forecasts only using an unbiased methodology and our articles are not intended to be financial advice. It does not constitute a recommendation to buy or sell any stock, and does not take account of your objectives, or your financial situation. We aim to bring you long-term focused analysis driven by fundamental data. Note that our analysis may not factor in the latest price-sensitive company announcements or qualitative material. Simply Wall St has no position in any stocks mentioned.
About SEHK:1792
CMON
An investment holding company, designs, develops, and sells board games, miniature war games, and other hobby products in North America, South America, Europe, Asia, and Oceania.
Adequate balance sheet with low risk.
Market Insights

Advertisement
Community Narratives
The company that turned a verb into a global necessity and basically runs the modern internet, digital ads, smartphones, maps, and AI.
Fair Value US$300.00|10.8% undervalued
OS
Community Contributor
Flowers Foods Pays A Fair Price For Health
Fair Value US$16.12|22.0% undervalued
NV
Community Contributor
TMX Group will thrive with 33.3% profit margin and enduring market moat
Fair Value CA$49.90|3.8% overvalued
LI
Community Contributor