- Hong Kong
- /
- Consumer Durables
- /
- SEHK:1691
JS Global Lifestyle (HKG:1691) Has Gifted Shareholders With A Fantastic 202% Total Return On Their Investment


Unfortunately, investing is risky - companies can and do go bankrupt. But when you pick a company that is really flourishing, you can make more than 100%. For example, the JS Global Lifestyle Company Limited (HKG:1691) share price has soared 176% in the last year. Most would be very happy with that, especially in just one year! On top of that, the share price is up 12% in about a quarter. But this move may well have been assisted by the reasonably buoyant market (up 12% in 90 days). Note that businesses generally develop over the long term, so the returns over the last year might not reflect a long term trend.
See our latest analysis for JS Global Lifestyle
To paraphrase Benjamin Graham: Over the short term the market is a voting machine, but over the long term it's a weighing machine. One imperfect but simple way to consider how the market perception of a company has shifted is to compare the change in the earnings per share (EPS) with the share price movement.
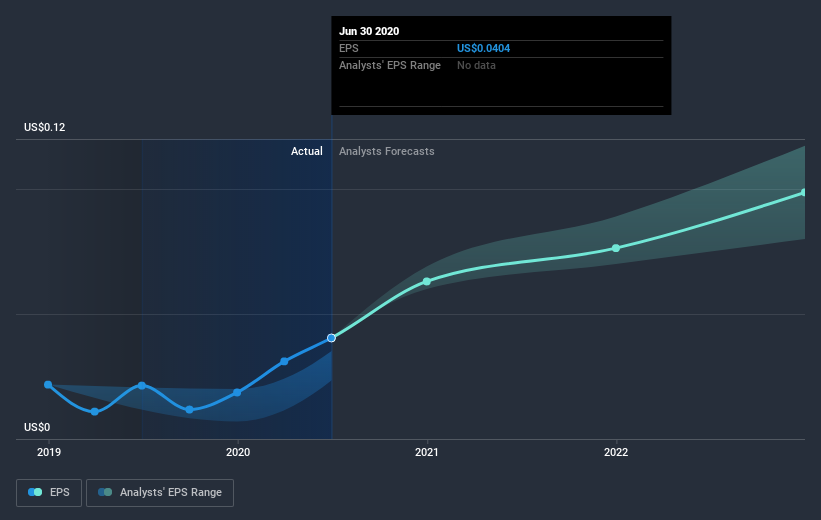
During the last year JS Global Lifestyle grew its earnings per share (EPS) by 90%. This EPS growth is significantly lower than the 176% increase in the share price. This indicates that the market is now more optimistic about the stock. The fairly generous P/E ratio of 50.03 also points to this optimism.
You can see below how EPS has changed over time (discover the exact values by clicking on the image).
We know that JS Global Lifestyle has improved its bottom line lately, but is it going to grow revenue? Check if analysts think JS Global Lifestyle will grow revenue in the future.
What about the Total Shareholder Return (TSR)?
Investors should note that there's a difference between JS Global Lifestyle's total shareholder return (TSR) and its share price change, which we've covered above. The TSR is a return calculation that accounts for the value of cash dividends (assuming that any dividend received was reinvested) and the calculated value of any discounted capital raisings and spin-offs. We note that JS Global Lifestyle's TSR, at 202% is higher than its share price return of 176%. When you consider it hasn't been paying a dividend, this data suggests shareholders have benefitted from a spin-off, or had the opportunity to acquire attractively priced shares in a discounted capital raising.
A Different Perspective
It's nice to see that JS Global Lifestyle shareholders have gained 202% over the last year. The more recent returns haven't been as impressive as the longer term returns, coming in at just 12%. It seems likely the market is waiting on fundamental developments with the business before pushing the share price higher (or lower). It's always interesting to track share price performance over the longer term. But to understand JS Global Lifestyle better, we need to consider many other factors. To that end, you should be aware of the 3 warning signs we've spotted with JS Global Lifestyle .
If you would prefer to check out another company -- one with potentially superior financials -- then do not miss this free list of companies that have proven they can grow earnings.
Please note, the market returns quoted in this article reflect the market weighted average returns of stocks that currently trade on HK exchanges.
When trading JS Global Lifestyle or any other investment, use the platform considered by many to be the Professional's Gateway to the Worlds Market, Interactive Brokers. You get the lowest-cost* trading on stocks, options, futures, forex, bonds and funds worldwide from a single integrated account. Promoted
New: Manage All Your Stock Portfolios in One Place
We've created the ultimate portfolio companion for stock investors, and it's free.
• Connect an unlimited number of Portfolios and see your total in one currency
• Be alerted to new Warning Signs or Risks via email or mobile
• Track the Fair Value of your stocks
This article by Simply Wall St is general in nature. It does not constitute a recommendation to buy or sell any stock, and does not take account of your objectives, or your financial situation. We aim to bring you long-term focused analysis driven by fundamental data. Note that our analysis may not factor in the latest price-sensitive company announcements or qualitative material. Simply Wall St has no position in any stocks mentioned.
*Interactive Brokers Rated Lowest Cost Broker by StockBrokers.com Annual Online Review 2020
Have feedback on this article? Concerned about the content? Get in touch with us directly. Alternatively, email editorial-team (at) simplywallst.com.
About SEHK:1691
JS Global Lifestyle
Engages in the design, manufacture, marketing, distribution, and export of small kitchen electrical appliances in Mainland China, Japan, Australia, New Zealand, and internationally.
Excellent balance sheet with moderate growth potential.
Similar Companies
Market Insights

Community Narratives

