The five-year shareholder returns and company earnings persist lower as Kingmaker Footwear Holdings (HKG:1170) stock falls a further 14% in past week


In order to justify the effort of selecting individual stocks, it's worth striving to beat the returns from a market index fund. But even the best stock picker will only win with some selections. So we wouldn't blame long term Kingmaker Footwear Holdings Limited (HKG:1170) shareholders for doubting their decision to hold, with the stock down 41% over a half decade. Unfortunately the share price momentum is still quite negative, with prices down 15% in thirty days. But this could be related to poor market conditions -- stocks are down 6.4% in the same time.
With the stock having lost 14% in the past week, it's worth taking a look at business performance and seeing if there's any red flags.
View our latest analysis for Kingmaker Footwear Holdings
While the efficient markets hypothesis continues to be taught by some, it has been proven that markets are over-reactive dynamic systems, and investors are not always rational. One flawed but reasonable way to assess how sentiment around a company has changed is to compare the earnings per share (EPS) with the share price.
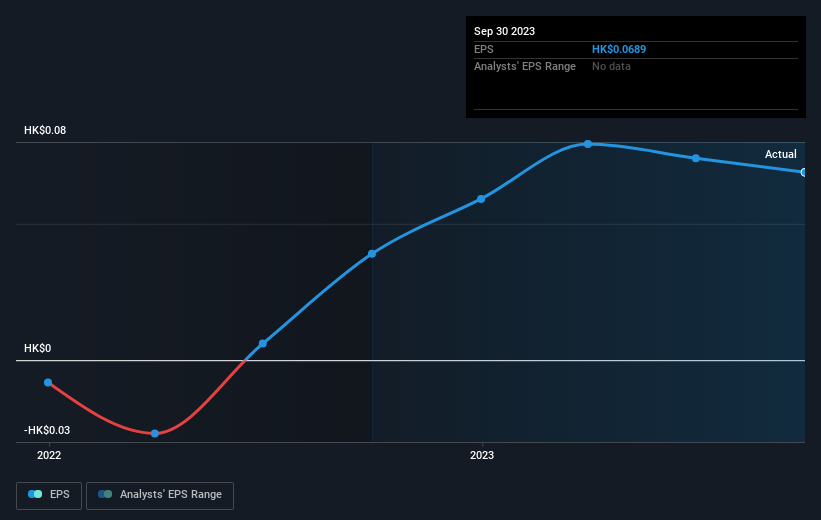
Looking back five years, both Kingmaker Footwear Holdings' share price and EPS declined; the latter at a rate of 7.0% per year. This reduction in EPS is less than the 10% annual reduction in the share price. This implies that the market is more cautious about the business these days. The less favorable sentiment is reflected in its current P/E ratio of 10.81.
You can see how EPS has changed over time in the image below (click on the chart to see the exact values).
Before buying or selling a stock, we always recommend a close examination of historic growth trends, available here.
What About Dividends?
As well as measuring the share price return, investors should also consider the total shareholder return (TSR). Whereas the share price return only reflects the change in the share price, the TSR includes the value of dividends (assuming they were reinvested) and the benefit of any discounted capital raising or spin-off. It's fair to say that the TSR gives a more complete picture for stocks that pay a dividend. As it happens, Kingmaker Footwear Holdings' TSR for the last 5 years was -25%, which exceeds the share price return mentioned earlier. And there's no prize for guessing that the dividend payments largely explain the divergence!
A Different Perspective
Investors in Kingmaker Footwear Holdings had a tough year, with a total loss of 5.8% (including dividends), against a market gain of about 1.3%. However, keep in mind that even the best stocks will sometimes underperform the market over a twelve month period. Unfortunately, last year's performance may indicate unresolved challenges, given that it was worse than the annualised loss of 5% over the last half decade. Generally speaking long term share price weakness can be a bad sign, though contrarian investors might want to research the stock in hope of a turnaround. It's always interesting to track share price performance over the longer term. But to understand Kingmaker Footwear Holdings better, we need to consider many other factors. Case in point: We've spotted 2 warning signs for Kingmaker Footwear Holdings you should be aware of.
We will like Kingmaker Footwear Holdings better if we see some big insider buys. While we wait, check out this free list of undervalued stocks (mostly small caps) with considerable, recent, insider buying.
Please note, the market returns quoted in this article reflect the market weighted average returns of stocks that currently trade on Hong Kong exchanges.
Valuation is complex, but we're here to simplify it.
Discover if Kingmaker Footwear Holdings might be undervalued or overvalued with our detailed analysis, featuring fair value estimates, potential risks, dividends, insider trades, and its financial condition.
Access Free AnalysisHave feedback on this article? Concerned about the content? Get in touch with us directly. Alternatively, email editorial-team (at) simplywallst.com.
This article by Simply Wall St is general in nature. We provide commentary based on historical data and analyst forecasts only using an unbiased methodology and our articles are not intended to be financial advice. It does not constitute a recommendation to buy or sell any stock, and does not take account of your objectives, or your financial situation. We aim to bring you long-term focused analysis driven by fundamental data. Note that our analysis may not factor in the latest price-sensitive company announcements or qualitative material. Simply Wall St has no position in any stocks mentioned.
Have feedback on this article? Concerned about the content? Get in touch with us directly. Alternatively, email editorial-team@simplywallst.com
About SEHK:1170
Kingmaker Footwear Holdings
An investment holding company, manufactures and sells footwear products in the United States, Europe, Asia, and internationally.
Flawless balance sheet with questionable track record.

