- Hong Kong
- /
- Commercial Services
- /
- SEHK:9690
Market Cool On TUHU Car Inc.'s (HKG:9690) Revenues Pushing Shares 29% Lower


To the annoyance of some shareholders, TUHU Car Inc. (HKG:9690) shares are down a considerable 29% in the last month, which continues a horrid run for the company. Longer-term shareholders will rue the drop in the share price, since it's now virtually flat for the year after a promising few quarters.
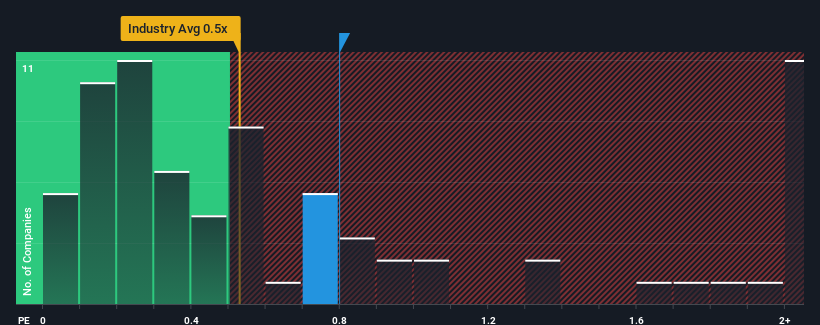
Although its price has dipped substantially, it's still not a stretch to say that TUHU Car's price-to-sales (or "P/S") ratio of 0.8x right now seems quite "middle-of-the-road" compared to the Commercial Services industry in Hong Kong, where the median P/S ratio is around 0.5x. While this might not raise any eyebrows, if the P/S ratio is not justified investors could be missing out on a potential opportunity or ignoring looming disappointment.
Check out our latest analysis for TUHU Car
What Does TUHU Car's P/S Mean For Shareholders?
With revenue growth that's superior to most other companies of late, TUHU Car has been doing relatively well. It might be that many expect the strong revenue performance to wane, which has kept the P/S ratio from rising. If you like the company, you'd be hoping this isn't the case so that you could potentially pick up some stock while it's not quite in favour.
Keen to find out how analysts think TUHU Car's future stacks up against the industry? In that case, our free report is a great place to start.Do Revenue Forecasts Match The P/S Ratio?
The only time you'd be comfortable seeing a P/S like TUHU Car's is when the company's growth is tracking the industry closely.
Retrospectively, the last year delivered an exceptional 18% gain to the company's top line. Pleasingly, revenue has also lifted 55% in aggregate from three years ago, thanks to the last 12 months of growth. So we can start by confirming that the company has done a great job of growing revenue over that time.
Turning to the outlook, the next three years should generate growth of 16% per annum as estimated by the eight analysts watching the company. Meanwhile, the rest of the industry is forecast to only expand by 6.0% per year, which is noticeably less attractive.
With this in consideration, we find it intriguing that TUHU Car's P/S is closely matching its industry peers. It may be that most investors aren't convinced the company can achieve future growth expectations.
The Key Takeaway
TUHU Car's plummeting stock price has brought its P/S back to a similar region as the rest of the industry. We'd say the price-to-sales ratio's power isn't primarily as a valuation instrument but rather to gauge current investor sentiment and future expectations.
Despite enticing revenue growth figures that outpace the industry, TUHU Car's P/S isn't quite what we'd expect. When we see a strong revenue outlook, with growth outpacing the industry, we can only assume potential uncertainty around these figures are what might be placing slight pressure on the P/S ratio. However, if you agree with the analysts' forecasts, you may be able to pick up the stock at an attractive price.
You need to take note of risks, for example - TUHU Car has 3 warning signs (and 1 which is a bit concerning) we think you should know about.
It's important to make sure you look for a great company, not just the first idea you come across. So if growing profitability aligns with your idea of a great company, take a peek at this free list of interesting companies with strong recent earnings growth (and a low P/E).
If you're looking to trade TUHU Car, open an account with the lowest-cost platform trusted by professionals, Interactive Brokers.
With clients in over 200 countries and territories, and access to 160 markets, IBKR lets you trade stocks, options, futures, forex, bonds and funds from a single integrated account.
Enjoy no hidden fees, no account minimums, and FX conversion rates as low as 0.03%, far better than what most brokers offer.
Sponsored ContentValuation is complex, but we're here to simplify it.
Discover if TUHU Car might be undervalued or overvalued with our detailed analysis, featuring fair value estimates, potential risks, dividends, insider trades, and its financial condition.
Access Free AnalysisHave feedback on this article? Concerned about the content? Get in touch with us directly. Alternatively, email editorial-team (at) simplywallst.com.
This article by Simply Wall St is general in nature. We provide commentary based on historical data and analyst forecasts only using an unbiased methodology and our articles are not intended to be financial advice. It does not constitute a recommendation to buy or sell any stock, and does not take account of your objectives, or your financial situation. We aim to bring you long-term focused analysis driven by fundamental data. Note that our analysis may not factor in the latest price-sensitive company announcements or qualitative material. Simply Wall St has no position in any stocks mentioned.
About SEHK:9690
TUHU Car
Operates as an integrated online and offline platform for automotive services in China.
Flawless balance sheet with reasonable growth potential.
Market Insights

Community Narratives

