- Hong Kong
- /
- Commercial Services
- /
- SEHK:8481
Shenglong Splendecor International Limited (HKG:8481) Stock Rockets 31% But Many Are Still Ignoring The Company


Shenglong Splendecor International Limited (HKG:8481) shares have continued their recent momentum with a 31% gain in the last month alone. The annual gain comes to 227% following the latest surge, making investors sit up and take notice.
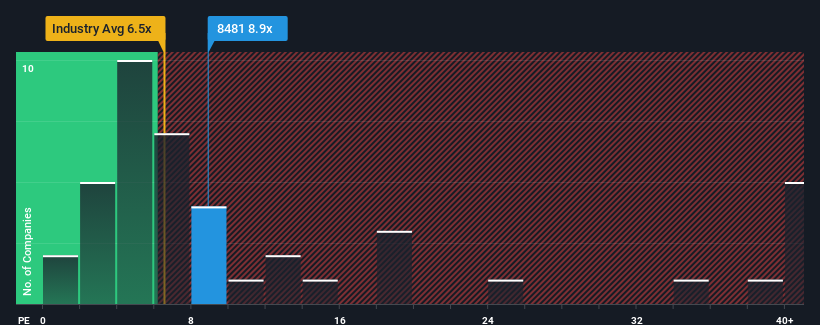
Although its price has surged higher, you could still be forgiven for feeling indifferent about Shenglong Splendecor International's P/E ratio of 8.9x, since the median price-to-earnings (or "P/E") ratio in Hong Kong is also close to 10x. However, investors might be overlooking a clear opportunity or potential setback if there is no rational basis for the P/E.
Recent times have been quite advantageous for Shenglong Splendecor International as its earnings have been rising very briskly. The P/E is probably moderate because investors think this strong earnings growth might not be enough to outperform the broader market in the near future. If you like the company, you'd be hoping this isn't the case so that you could potentially pick up some stock while it's not quite in favour.
View our latest analysis for Shenglong Splendecor International
What Are Growth Metrics Telling Us About The P/E?
Shenglong Splendecor International's P/E ratio would be typical for a company that's only expected to deliver moderate growth, and importantly, perform in line with the market.
Taking a look back first, we see that the company grew earnings per share by an impressive 135% last year. The latest three year period has also seen an excellent 210% overall rise in EPS, aided by its short-term performance. Therefore, it's fair to say the earnings growth recently has been superb for the company.
Comparing that to the market, which is only predicted to deliver 20% growth in the next 12 months, the company's momentum is stronger based on recent medium-term annualised earnings results.
With this information, we find it interesting that Shenglong Splendecor International is trading at a fairly similar P/E to the market. Apparently some shareholders believe the recent performance is at its limits and have been accepting lower selling prices.
The Final Word
Shenglong Splendecor International's stock has a lot of momentum behind it lately, which has brought its P/E level with the market. Using the price-to-earnings ratio alone to determine if you should sell your stock isn't sensible, however it can be a practical guide to the company's future prospects.
Our examination of Shenglong Splendecor International revealed its three-year earnings trends aren't contributing to its P/E as much as we would have predicted, given they look better than current market expectations. When we see strong earnings with faster-than-market growth, we assume potential risks are what might be placing pressure on the P/E ratio. At least the risk of a price drop looks to be subdued if recent medium-term earnings trends continue, but investors seem to think future earnings could see some volatility.
You should always think about risks. Case in point, we've spotted 3 warning signs for Shenglong Splendecor International you should be aware of.
You might be able to find a better investment than Shenglong Splendecor International. If you want a selection of possible candidates, check out this free list of interesting companies that trade on a low P/E (but have proven they can grow earnings).
If you're looking to trade Shenglong Splendecor International, open an account with the lowest-cost platform trusted by professionals, Interactive Brokers.
With clients in over 200 countries and territories, and access to 160 markets, IBKR lets you trade stocks, options, futures, forex, bonds and funds from a single integrated account.
Enjoy no hidden fees, no account minimums, and FX conversion rates as low as 0.03%, far better than what most brokers offer.
Sponsored ContentNew: Manage All Your Stock Portfolios in One Place
We've created the ultimate portfolio companion for stock investors, and it's free.
• Connect an unlimited number of Portfolios and see your total in one currency
• Be alerted to new Warning Signs or Risks via email or mobile
• Track the Fair Value of your stocks
Have feedback on this article? Concerned about the content? Get in touch with us directly. Alternatively, email editorial-team (at) simplywallst.com.
This article by Simply Wall St is general in nature. We provide commentary based on historical data and analyst forecasts only using an unbiased methodology and our articles are not intended to be financial advice. It does not constitute a recommendation to buy or sell any stock, and does not take account of your objectives, or your financial situation. We aim to bring you long-term focused analysis driven by fundamental data. Note that our analysis may not factor in the latest price-sensitive company announcements or qualitative material. Simply Wall St has no position in any stocks mentioned.
About SEHK:8481
Shenglong Splendecor International
An investment holding company, engages in the manufacture and sale of decorative printing materials in the People’s Republic of China, Pakistan, India, Indonesia, the United Arab Emirates, and internationally.
Proven track record with mediocre balance sheet.
Market Insights

Community Narratives

