- Hong Kong
- /
- Professional Services
- /
- SEHK:8462
Omnibridge Holdings Full Year 2023 Earnings: EPS: S$0.003 (vs S$0.002 in FY 2022)


Omnibridge Holdings (HKG:8462) Full Year 2023 Results
Key Financial Results
- Revenue: S$61.5m (down 35% from FY 2022).
- Net income: S$1.84m (up 97% from FY 2022).
- Profit margin: 3.0% (up from 1.0% in FY 2022).
- EPS: S$0.003 (up from S$0.002 in FY 2022).
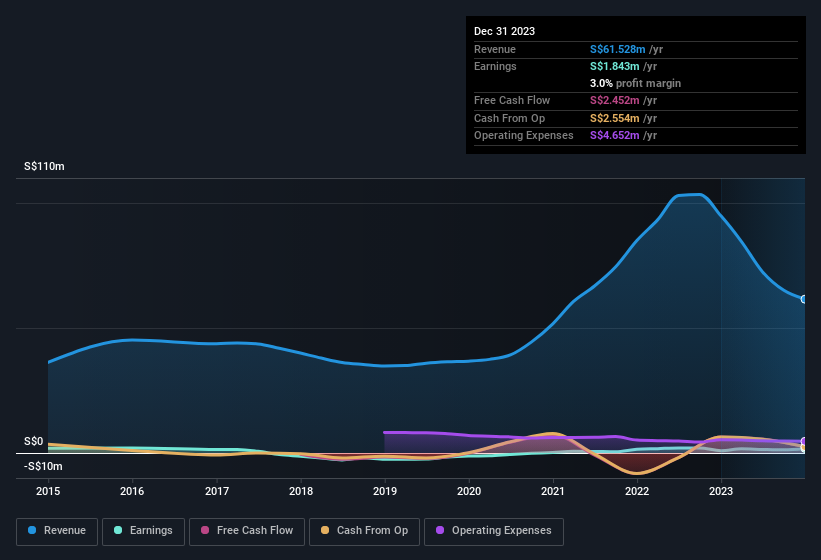
All figures shown in the chart above are for the trailing 12 month (TTM) period
Omnibridge Holdings shares are down 21% from a week ago.
Risk Analysis
You should always think about risks. Case in point, we've spotted 3 warning signs for Omnibridge Holdings you should be aware of, and 1 of them doesn't sit too well with us.
New: AI Stock Screener & Alerts
Our new AI Stock Screener scans the market every day to uncover opportunities.
• Dividend Powerhouses (3%+ Yield)
• Undervalued Small Caps with Insider Buying
• High growth Tech and AI Companies
Or build your own from over 50 metrics.
Have feedback on this article? Concerned about the content? Get in touch with us directly. Alternatively, email editorial-team (at) simplywallst.com.
This article by Simply Wall St is general in nature. We provide commentary based on historical data and analyst forecasts only using an unbiased methodology and our articles are not intended to be financial advice. It does not constitute a recommendation to buy or sell any stock, and does not take account of your objectives, or your financial situation. We aim to bring you long-term focused analysis driven by fundamental data. Note that our analysis may not factor in the latest price-sensitive company announcements or qualitative material. Simply Wall St has no position in any stocks mentioned.
About SEHK:8462
Omnibridge Holdings
An investment holding company, provides human resources outsourcing and recruitment services to public and private sectors in Singapore and Hong Kong.
Flawless balance sheet with proven track record.
