
Advertisement
- Hong Kong
- /
- Commercial Services
- /
- SEHK:8416
HM International Holdings Limited (HKG:8416) Stocks Pounded By 27% But Not Lagging Industry On Growth Or Pricing

HM International Holdings Limited (HKG:8416) shareholders won't be pleased to see that the share price has had a very rough month, dropping 27% and undoing the prior period's positive performance. Longer-term, the stock has been solid despite a difficult 30 days, gaining 11% in the last year.
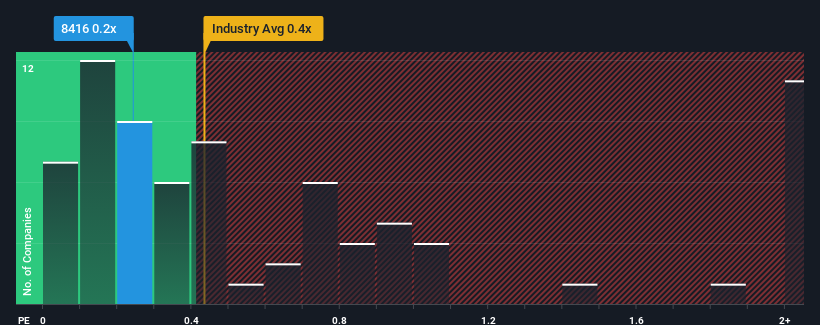
In spite of the heavy fall in price, it's still not a stretch to say that HM International Holdings' price-to-sales (or "P/S") ratio of 0.2x right now seems quite "middle-of-the-road" compared to the Commercial Services industry in Hong Kong, where the median P/S ratio is around 0.4x. However, investors might be overlooking a clear opportunity or potential setback if there is no rational basis for the P/S.
See our latest analysis for HM International Holdings
What Does HM International Holdings' Recent Performance Look Like?
For instance, HM International Holdings' receding revenue in recent times would have to be some food for thought. Perhaps investors believe the recent revenue performance is enough to keep in line with the industry, which is keeping the P/S from dropping off. If not, then existing shareholders may be a little nervous about the viability of the share price.
Want the full picture on earnings, revenue and cash flow for the company? Then our free report on HM International Holdings will help you shine a light on its historical performance.Do Revenue Forecasts Match The P/S Ratio?
In order to justify its P/S ratio, HM International Holdings would need to produce growth that's similar to the industry.
In reviewing the last year of financials, we were disheartened to see the company's revenues fell to the tune of 7.8%. This has soured the latest three-year period, which nevertheless managed to deliver a decent 17% overall rise in revenue. Although it's been a bumpy ride, it's still fair to say the revenue growth recently has been mostly respectable for the company.
Comparing that to the industry, which is predicted to deliver 5.5% growth in the next 12 months, the company's momentum is pretty similar based on recent medium-term annualised revenue results.
With this in consideration, it's clear to see why HM International Holdings' P/S matches up closely to its industry peers. Apparently shareholders are comfortable to simply hold on assuming the company will continue keeping a low profile.
The Key Takeaway
Following HM International Holdings' share price tumble, its P/S is just clinging on to the industry median P/S. Generally, our preference is to limit the use of the price-to-sales ratio to establishing what the market thinks about the overall health of a company.
It appears to us that HM International Holdings maintains its moderate P/S off the back of its recent three-year growth being in line with the wider industry forecast. Right now shareholders are comfortable with the P/S as they are quite confident future revenue won't throw up any surprises. Given the current circumstances, it seems improbable that the share price will experience any significant movement in either direction in the near future if recent medium-term revenue trends persist.
Having said that, be aware HM International Holdings is showing 3 warning signs in our investment analysis, and 1 of those shouldn't be ignored.
If these risks are making you reconsider your opinion on HM International Holdings, explore our interactive list of high quality stocks to get an idea of what else is out there.
Valuation is complex, but we're here to simplify it.
Discover if HM International Holdings might be undervalued or overvalued with our detailed analysis, featuring fair value estimates, potential risks, dividends, insider trades, and its financial condition.
Access Free AnalysisHave feedback on this article? Concerned about the content? Get in touch with us directly. Alternatively, email editorial-team (at) simplywallst.com.
This article by Simply Wall St is general in nature. We provide commentary based on historical data and analyst forecasts only using an unbiased methodology and our articles are not intended to be financial advice. It does not constitute a recommendation to buy or sell any stock, and does not take account of your objectives, or your financial situation. We aim to bring you long-term focused analysis driven by fundamental data. Note that our analysis may not factor in the latest price-sensitive company announcements or qualitative material. Simply Wall St has no position in any stocks mentioned.
About SEHK:8416
HM International Holdings
An investment holding company, provides integrated printing services in Hong Kong.
Mediocre balance sheet and slightly overvalued.
Market Insights

Advertisement
Community Narratives

BMW cruising ahead with new EVs and premium models to boost revenue 5%
Fair Value €135.07|44.5% undervalued
UN
Community Contributor
EU#2 - From Humble Beginnings to Global Powerhouse
Fair Value DKK 851.04|46.1% undervalued
TO
Community Contributor