
Advertisement
- Hong Kong
- /
- Commercial Services
- /
- SEHK:8416
HM International Holdings (HKG:8416) Will Be Hoping To Turn Its Returns On Capital Around

When we're researching a company, it's sometimes hard to find the warning signs, but there are some financial metrics that can help spot trouble early. Businesses in decline often have two underlying trends, firstly, a declining return on capital employed (ROCE) and a declining base of capital employed. Ultimately this means that the company is earning less per dollar invested and on top of that, it's shrinking its base of capital employed. In light of that, from a first glance at HM International Holdings (HKG:8416), we've spotted some signs that it could be struggling, so let's investigate.
Understanding Return On Capital Employed (ROCE)
If you haven't worked with ROCE before, it measures the 'return' (pre-tax profit) a company generates from capital employed in its business. The formula for this calculation on HM International Holdings is:
Return on Capital Employed = Earnings Before Interest and Tax (EBIT) ÷ (Total Assets - Current Liabilities)
0.031 = HK$2.8m ÷ (HK$152m - HK$60m) (Based on the trailing twelve months to September 2023).
So, HM International Holdings has an ROCE of 3.1%. Ultimately, that's a low return and it under-performs the Commercial Services industry average of 7.8%.
View our latest analysis for HM International Holdings
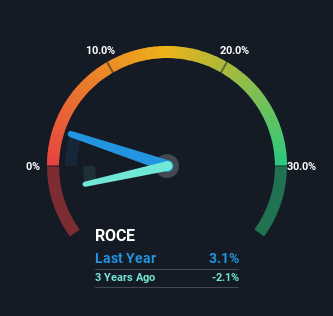
While the past is not representative of the future, it can be helpful to know how a company has performed historically, which is why we have this chart above. If you're interested in investigating HM International Holdings' past further, check out this free graph of past earnings, revenue and cash flow.
What Does the ROCE Trend For HM International Holdings Tell Us?
In terms of HM International Holdings' historical ROCE movements, the trend doesn't inspire confidence. About five years ago, returns on capital were 9.8%, however they're now substantially lower than that as we saw above. Meanwhile, capital employed in the business has stayed roughly the flat over the period. This combination can be indicative of a mature business that still has areas to deploy capital, but the returns received aren't as high due potentially to new competition or smaller margins. So because these trends aren't typically conducive to creating a multi-bagger, we wouldn't hold our breath on HM International Holdings becoming one if things continue as they have.
While on the subject, we noticed that the ratio of current liabilities to total assets has risen to 40%, which has impacted the ROCE. Without this increase, it's likely that ROCE would be even lower than 3.1%. Keep an eye on this ratio, because the business could encounter some new risks if this metric gets too high.
The Bottom Line On HM International Holdings' ROCE
All in all, the lower returns from the same amount of capital employed aren't exactly signs of a compounding machine. Long term shareholders who've owned the stock over the last five years have experienced a 65% depreciation in their investment, so it appears the market might not like these trends either. That being the case, unless the underlying trends revert to a more positive trajectory, we'd consider looking elsewhere.
HM International Holdings does have some risks, we noticed 6 warning signs (and 2 which make us uncomfortable) we think you should know about.
While HM International Holdings isn't earning the highest return, check out this free list of companies that are earning high returns on equity with solid balance sheets.
Valuation is complex, but we're here to simplify it.
Discover if HM International Holdings might be undervalued or overvalued with our detailed analysis, featuring fair value estimates, potential risks, dividends, insider trades, and its financial condition.
Access Free AnalysisHave feedback on this article? Concerned about the content? Get in touch with us directly. Alternatively, email editorial-team (at) simplywallst.com.
This article by Simply Wall St is general in nature. We provide commentary based on historical data and analyst forecasts only using an unbiased methodology and our articles are not intended to be financial advice. It does not constitute a recommendation to buy or sell any stock, and does not take account of your objectives, or your financial situation. We aim to bring you long-term focused analysis driven by fundamental data. Note that our analysis may not factor in the latest price-sensitive company announcements or qualitative material. Simply Wall St has no position in any stocks mentioned.
About SEHK:8416
HM International Holdings
An investment holding company, provides integrated printing services in Hong Kong.
Mediocre balance sheet and slightly overvalued.
Market Insights

Advertisement
Community Narratives

BMW cruising ahead with new EVs and premium models to boost revenue 5%
Fair Value €135.07|44.5% undervalued
UN
Community Contributor
EU#2 - From Humble Beginnings to Global Powerhouse
Fair Value DKK 851.04|46.1% undervalued
TO
Community Contributor