- Hong Kong
- /
- Professional Services
- /
- SEHK:8293
Not Many Are Piling Into SingAsia Holdings Limited (HKG:8293) Stock Yet As It Plummets 26%


Unfortunately for some shareholders, the SingAsia Holdings Limited (HKG:8293) share price has dived 26% in the last thirty days, prolonging recent pain. For any long-term shareholders, the last month ends a year to forget by locking in a 78% share price decline.
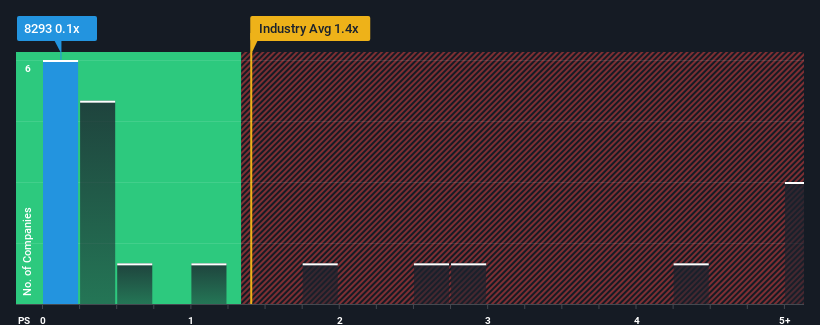
In spite of the heavy fall in price, you could still be forgiven for feeling indifferent about SingAsia Holdings' P/S ratio of 0.1x, since the median price-to-sales (or "P/S") ratio for the Professional Services industry in Hong Kong is also close to 0.3x. However, investors might be overlooking a clear opportunity or potential setback if there is no rational basis for the P/S.
View our latest analysis for SingAsia Holdings
What Does SingAsia Holdings' P/S Mean For Shareholders?
It looks like revenue growth has deserted SingAsia Holdings recently, which is not something to boast about. Perhaps the market believes the recent run-of-the-mill revenue performance isn't enough to outperform the industry, which has kept the P/S muted. Those who are bullish on SingAsia Holdings will be hoping that this isn't the case, so that they can pick up the stock at a lower valuation.
Want the full picture on earnings, revenue and cash flow for the company? Then our free report on SingAsia Holdings will help you shine a light on its historical performance.What Are Revenue Growth Metrics Telling Us About The P/S?
There's an inherent assumption that a company should be matching the industry for P/S ratios like SingAsia Holdings' to be considered reasonable.
Retrospectively, the last year delivered virtually the same number to the company's top line as the year before. Still, the latest three year period has seen an excellent 130% overall rise in revenue, in spite of its uninspiring short-term performance. Therefore, it's fair to say the revenue growth recently has been great for the company, but investors will want to ask why it has slowed to such an extent.
This is in contrast to the rest of the industry, which is expected to grow by 9.9% over the next year, materially lower than the company's recent medium-term annualised growth rates.
With this information, we find it interesting that SingAsia Holdings is trading at a fairly similar P/S compared to the industry. It may be that most investors are not convinced the company can maintain its recent growth rates.
The Final Word
Following SingAsia Holdings' share price tumble, its P/S is just clinging on to the industry median P/S. While the price-to-sales ratio shouldn't be the defining factor in whether you buy a stock or not, it's quite a capable barometer of revenue expectations.
We've established that SingAsia Holdings currently trades on a lower than expected P/S since its recent three-year growth is higher than the wider industry forecast. It'd be fair to assume that potential risks the company faces could be the contributing factor to the lower than expected P/S. At least the risk of a price drop looks to be subdued if recent medium-term revenue trends continue, but investors seem to think future revenue could see some volatility.
Plus, you should also learn about these 3 warning signs we've spotted with SingAsia Holdings.
Of course, profitable companies with a history of great earnings growth are generally safer bets. So you may wish to see this free collection of other companies that have reasonable P/E ratios and have grown earnings strongly.
If you're looking to trade SingAsia Holdings, open an account with the lowest-cost platform trusted by professionals, Interactive Brokers.
With clients in over 200 countries and territories, and access to 160 markets, IBKR lets you trade stocks, options, futures, forex, bonds and funds from a single integrated account.
Enjoy no hidden fees, no account minimums, and FX conversion rates as low as 0.03%, far better than what most brokers offer.
Sponsored ContentNew: Manage All Your Stock Portfolios in One Place
We've created the ultimate portfolio companion for stock investors, and it's free.
• Connect an unlimited number of Portfolios and see your total in one currency
• Be alerted to new Warning Signs or Risks via email or mobile
• Track the Fair Value of your stocks
Have feedback on this article? Concerned about the content? Get in touch with us directly. Alternatively, email editorial-team (at) simplywallst.com.
This article by Simply Wall St is general in nature. We provide commentary based on historical data and analyst forecasts only using an unbiased methodology and our articles are not intended to be financial advice. It does not constitute a recommendation to buy or sell any stock, and does not take account of your objectives, or your financial situation. We aim to bring you long-term focused analysis driven by fundamental data. Note that our analysis may not factor in the latest price-sensitive company announcements or qualitative material. Simply Wall St has no position in any stocks mentioned.
About SEHK:8293
SingAsia Holdings
An investment holding company, provides workforce solutions in Singapore.
Slight with mediocre balance sheet.
Market Insights

Community Narratives

