- Hong Kong
- /
- Professional Services
- /
- SEHK:6128
Take Care Before Jumping Onto Graphex Group Limited (HKG:6128) Even Though It's 26% Cheaper


To the annoyance of some shareholders, Graphex Group Limited (HKG:6128) shares are down a considerable 26% in the last month, which continues a horrid run for the company. The recent drop completes a disastrous twelve months for shareholders, who are sitting on a 72% loss during that time.
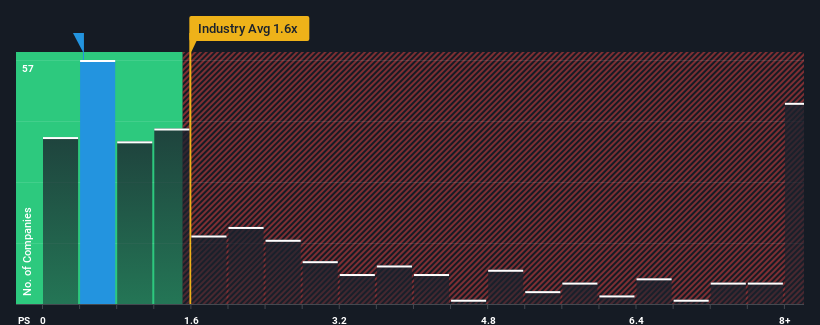
In spite of the heavy fall in price, there still wouldn't be many who think Graphex Group's price-to-sales (or "P/S") ratio of 0.4x is worth a mention when the median P/S in Hong Kong's Professional Services industry is similar at about 0.5x. However, investors might be overlooking a clear opportunity or potential setback if there is no rational basis for the P/S.
Check out our latest analysis for Graphex Group
How Has Graphex Group Performed Recently?
Graphex Group could be doing better as its revenue has been going backwards lately while most other companies have been seeing positive revenue growth. Perhaps the market is expecting its poor revenue performance to improve, keeping the P/S from dropping. However, if this isn't the case, investors might get caught out paying too much for the stock.
Keen to find out how analysts think Graphex Group's future stacks up against the industry? In that case, our free report is a great place to start.Do Revenue Forecasts Match The P/S Ratio?
There's an inherent assumption that a company should be matching the industry for P/S ratios like Graphex Group's to be considered reasonable.
In reviewing the last year of financials, we were disheartened to see the company's revenues fell to the tune of 14%. This means it has also seen a slide in revenue over the longer-term as revenue is down 25% in total over the last three years. Therefore, it's fair to say the revenue growth recently has been undesirable for the company.
Turning to the outlook, the next year should generate growth of 22% as estimated by the only analyst watching the company. Meanwhile, the rest of the industry is forecast to only expand by 18%, which is noticeably less attractive.
In light of this, it's curious that Graphex Group's P/S sits in line with the majority of other companies. It may be that most investors aren't convinced the company can achieve future growth expectations.
The Bottom Line On Graphex Group's P/S
With its share price dropping off a cliff, the P/S for Graphex Group looks to be in line with the rest of the Professional Services industry. It's argued the price-to-sales ratio is an inferior measure of value within certain industries, but it can be a powerful business sentiment indicator.
We've established that Graphex Group currently trades on a lower than expected P/S since its forecasted revenue growth is higher than the wider industry. Perhaps uncertainty in the revenue forecasts are what's keeping the P/S ratio consistent with the rest of the industry. However, if you agree with the analysts' forecasts, you may be able to pick up the stock at an attractive price.
Before you take the next step, you should know about the 4 warning signs for Graphex Group (1 makes us a bit uncomfortable!) that we have uncovered.
If strong companies turning a profit tickle your fancy, then you'll want to check out this free list of interesting companies that trade on a low P/E (but have proven they can grow earnings).
If you're looking to trade Graphex Group, open an account with the lowest-cost platform trusted by professionals, Interactive Brokers.
With clients in over 200 countries and territories, and access to 160 markets, IBKR lets you trade stocks, options, futures, forex, bonds and funds from a single integrated account.
Enjoy no hidden fees, no account minimums, and FX conversion rates as low as 0.03%, far better than what most brokers offer.
Sponsored ContentNew: Manage All Your Stock Portfolios in One Place
We've created the ultimate portfolio companion for stock investors, and it's free.
• Connect an unlimited number of Portfolios and see your total in one currency
• Be alerted to new Warning Signs or Risks via email or mobile
• Track the Fair Value of your stocks
Have feedback on this article? Concerned about the content? Get in touch with us directly. Alternatively, email editorial-team (at) simplywallst.com.
This article by Simply Wall St is general in nature. We provide commentary based on historical data and analyst forecasts only using an unbiased methodology and our articles are not intended to be financial advice. It does not constitute a recommendation to buy or sell any stock, and does not take account of your objectives, or your financial situation. We aim to bring you long-term focused analysis driven by fundamental data. Note that our analysis may not factor in the latest price-sensitive company announcements or qualitative material. Simply Wall St has no position in any stocks mentioned.
About SEHK:6128
Graphex Group
Engages in the processing and sale of graphite and graphene products in Mainland China, Hong Kong, and internationally.
Slight and fair value.
Market Insights

Community Narratives

