
Advertisement
- Hong Kong
- /
- Professional Services
- /
- SEHK:1486
There Are Reasons To Feel Uneasy About C Cheng Holdings' (HKG:1486) Returns On Capital
If we want to find a potential multi-bagger, often there are underlying trends that can provide clues. Firstly, we'd want to identify a growing return on capital employed (ROCE) and then alongside that, an ever-increasing base of capital employed. This shows us that it's a compounding machine, able to continually reinvest its earnings back into the business and generate higher returns. Although, when we looked at C Cheng Holdings (HKG:1486), it didn't seem to tick all of these boxes.
What is Return On Capital Employed (ROCE)?
For those that aren't sure what ROCE is, it measures the amount of pre-tax profits a company can generate from the capital employed in its business. Analysts use this formula to calculate it for C Cheng Holdings:
Return on Capital Employed = Earnings Before Interest and Tax (EBIT) ÷ (Total Assets - Current Liabilities)
0.0044 = HK$2.3m ÷ (HK$800m - HK$272m) (Based on the trailing twelve months to June 2020).
Thus, C Cheng Holdings has an ROCE of 0.4%. In absolute terms, that's a low return and it also under-performs the Professional Services industry average of 13%.
Check out our latest analysis for C Cheng Holdings
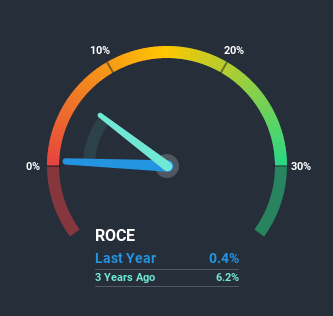
Historical performance is a great place to start when researching a stock so above you can see the gauge for C Cheng Holdings' ROCE against it's prior returns. If you'd like to look at how C Cheng Holdings has performed in the past in other metrics, you can view this free graph of past earnings, revenue and cash flow.
The Trend Of ROCE
On the surface, the trend of ROCE at C Cheng Holdings doesn't inspire confidence. Around five years ago the returns on capital were 24%, but since then they've fallen to 0.4%. However it looks like C Cheng Holdings might be reinvesting for long term growth because while capital employed has increased, the company's sales haven't changed much in the last 12 months. It's worth keeping an eye on the company's earnings from here on to see if these investments do end up contributing to the bottom line.
On a related note, C Cheng Holdings has decreased its current liabilities to 34% of total assets. So we could link some of this to the decrease in ROCE. What's more, this can reduce some aspects of risk to the business because now the company's suppliers or short-term creditors are funding less of its operations. Some would claim this reduces the business' efficiency at generating ROCE since it is now funding more of the operations with its own money.
The Bottom Line
Bringing it all together, while we're somewhat encouraged by C Cheng Holdings' reinvestment in its own business, we're aware that returns are shrinking. Since the stock has declined 17% over the last five years, investors may not be too optimistic on this trend improving either. In any case, the stock doesn't have these traits of a multi-bagger discussed above, so if that's what you're looking for, we think you'd have more luck elsewhere.
If you want to know some of the risks facing C Cheng Holdings we've found 4 warning signs (1 makes us a bit uncomfortable!) that you should be aware of before investing here.
While C Cheng Holdings may not currently earn the highest returns, we've compiled a list of companies that currently earn more than 25% return on equity. Check out this free list here.
If you’re looking to trade C Cheng Holdings, open an account with the lowest-cost* platform trusted by professionals, Interactive Brokers. Their clients from over 200 countries and territories trade stocks, options, futures, forex, bonds and funds worldwide from a single integrated account. Promoted
New: AI Stock Screener & Alerts
Our new AI Stock Screener scans the market every day to uncover opportunities.
• Dividend Powerhouses (3%+ Yield)
• Undervalued Small Caps with Insider Buying
• High growth Tech and AI Companies
Or build your own from over 50 metrics.
This article by Simply Wall St is general in nature. It does not constitute a recommendation to buy or sell any stock, and does not take account of your objectives, or your financial situation. We aim to bring you long-term focused analysis driven by fundamental data. Note that our analysis may not factor in the latest price-sensitive company announcements or qualitative material. Simply Wall St has no position in any stocks mentioned.
*Interactive Brokers Rated Lowest Cost Broker by StockBrokers.com Annual Online Review 2020
Have feedback on this article? Concerned about the content? Get in touch with us directly. Alternatively, email editorial-team (at) simplywallst.com.
About SEHK:1486
C Cheng Holdings
An investment holding company, provides architectural services in Mainland China, Hong Kong, the Middle East and North Africa, Macau, and internationally.
Excellent balance sheet and good value.
Market Insights

Advertisement
Community Narratives
MINISO's fair value is projected at 26.69 with an anticipated PE ratio shift of 20x
Fair Value US$24.03|9.0% undervalued
BE
Community Contributor
Procter & Gamble: A Dividend Giant Facing Slowing Growth
Fair Value US$119.81|23.5% overvalued
AN
Community Contributor
Eli Lilly's Future Growth Driven by Tirzepatide and Favorable Market Conditions
Fair Value US$1.19k|14.4% undervalued
EA
Community Contributor