
Advertisement
- Hong Kong
- /
- Construction
- /
- SEHK:9998
Returns On Capital At Kwan Yong Holdings (HKG:9998) Paint A Concerning Picture
When we're researching a company, it's sometimes hard to find the warning signs, but there are some financial metrics that can help spot trouble early. Typically, we'll see the trend of both return on capital employed (ROCE) declining and this usually coincides with a decreasing amount of capital employed. This combination can tell you that not only is the company investing less, it's earning less on what it does invest. On that note, looking into Kwan Yong Holdings (HKG:9998), we weren't too upbeat about how things were going.
Understanding Return On Capital Employed (ROCE)
If you haven't worked with ROCE before, it measures the 'return' (pre-tax profit) a company generates from capital employed in its business. The formula for this calculation on Kwan Yong Holdings is:
Return on Capital Employed = Earnings Before Interest and Tax (EBIT) ÷ (Total Assets - Current Liabilities)
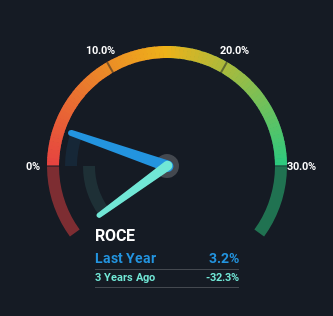
0.032 = S$1.3m ÷ (S$85m - S$46m) (Based on the trailing twelve months to June 2023).
Thus, Kwan Yong Holdings has an ROCE of 3.2%. In absolute terms, that's a low return and it also under-performs the Construction industry average of 6.5%.
Check out our latest analysis for Kwan Yong Holdings
While the past is not representative of the future, it can be helpful to know how a company has performed historically, which is why we have this chart above. If you're interested in investigating Kwan Yong Holdings' past further, check out this free graph of past earnings, revenue and cash flow.
The Trend Of ROCE
There is reason to be cautious about Kwan Yong Holdings, given the returns are trending downwards. About five years ago, returns on capital were 15%, however they're now substantially lower than that as we saw above. And on the capital employed front, the business is utilizing roughly the same amount of capital as it was back then. Since returns are falling and the business has the same amount of assets employed, this can suggest it's a mature business that hasn't had much growth in the last five years. So because these trends aren't typically conducive to creating a multi-bagger, we wouldn't hold our breath on Kwan Yong Holdings becoming one if things continue as they have.
On a side note, Kwan Yong Holdings' current liabilities have increased over the last five years to 54% of total assets, effectively distorting the ROCE to some degree. If current liabilities hadn't increased as much as they did, the ROCE could actually be even lower. What this means is that in reality, a rather large portion of the business is being funded by the likes of the company's suppliers or short-term creditors, which can bring some risks of its own.
In Conclusion...
All in all, the lower returns from the same amount of capital employed aren't exactly signs of a compounding machine. It should come as no surprise then that the stock has fallen 38% over the last three years, so it looks like investors are recognizing these changes. Unless there is a shift to a more positive trajectory in these metrics, we would look elsewhere.
Since virtually every company faces some risks, it's worth knowing what they are, and we've spotted 2 warning signs for Kwan Yong Holdings (of which 1 is a bit concerning!) that you should know about.
If you want to search for solid companies with great earnings, check out this free list of companies with good balance sheets and impressive returns on equity.
Valuation is complex, but we're here to simplify it.
Discover if Kwan Yong Holdings might be undervalued or overvalued with our detailed analysis, featuring fair value estimates, potential risks, dividends, insider trades, and its financial condition.
Access Free AnalysisHave feedback on this article? Concerned about the content? Get in touch with us directly. Alternatively, email editorial-team (at) simplywallst.com.
This article by Simply Wall St is general in nature. We provide commentary based on historical data and analyst forecasts only using an unbiased methodology and our articles are not intended to be financial advice. It does not constitute a recommendation to buy or sell any stock, and does not take account of your objectives, or your financial situation. We aim to bring you long-term focused analysis driven by fundamental data. Note that our analysis may not factor in the latest price-sensitive company announcements or qualitative material. Simply Wall St has no position in any stocks mentioned.
About SEHK:9998
Kwan Yong Holdings
An investment holding company, engages in the provision of general building and construction services in Singapore.
Outstanding track record with flawless balance sheet.
Market Insights

Advertisement
Community Narratives
Finding The True Value Of A Logistics Powerhouse
Fair Value US$95.21|8.5% undervalued
NV
Community Contributor
Paradigm Biopharmaceuticals Will Lead Osteoarthritis Treatment with Zilosul's FDA Success
Fair Value AU$5.50|91.9% undervalued
AM
Community Contributor
Barrick Mining (ABX:CA): A Gold Hedge against a U.S. Shutdown
Fair Value CA$60.00|26.5% undervalued
GM
Community Contributor