
Advertisement
- Hong Kong
- /
- Trade Distributors
- /
- SEHK:8196
Investors Give China TianYF Holdings Group Limited (HKG:8196) Shares A 30% Hiding

The China TianYF Holdings Group Limited (HKG:8196) share price has softened a substantial 30% over the previous 30 days, handing back much of the gains the stock has made lately. The recent drop completes a disastrous twelve months for shareholders, who are sitting on a 74% loss during that time.
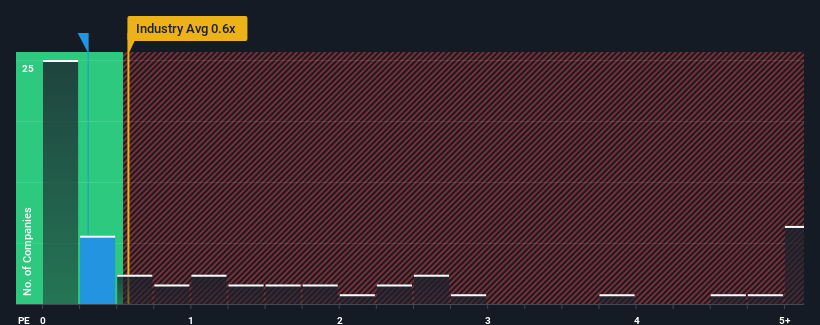
Although its price has dipped substantially, it's still not a stretch to say that China TianYF Holdings Group's price-to-sales (or "P/S") ratio of 0.3x right now seems quite "middle-of-the-road" compared to the Trade Distributors industry in Hong Kong, where the median P/S ratio is around 0.6x. While this might not raise any eyebrows, if the P/S ratio is not justified investors could be missing out on a potential opportunity or ignoring looming disappointment.
View our latest analysis for China TianYF Holdings Group
What Does China TianYF Holdings Group's Recent Performance Look Like?
China TianYF Holdings Group has been doing a good job lately as it's been growing revenue at a solid pace. Perhaps the market is expecting future revenue performance to only keep up with the broader industry, which has keeping the P/S in line with expectations. If you like the company, you'd be hoping this isn't the case so that you could potentially pick up some stock while it's not quite in favour.
We don't have analyst forecasts, but you can see how recent trends are setting up the company for the future by checking out our free report on China TianYF Holdings Group's earnings, revenue and cash flow.How Is China TianYF Holdings Group's Revenue Growth Trending?
China TianYF Holdings Group's P/S ratio would be typical for a company that's only expected to deliver moderate growth, and importantly, perform in line with the industry.
Retrospectively, the last year delivered an exceptional 21% gain to the company's top line. The strong recent performance means it was also able to grow revenue by 67% in total over the last three years. So we can start by confirming that the company has done a great job of growing revenue over that time.
Comparing that recent medium-term revenue trajectory with the industry's one-year growth forecast of 3.7% shows it's noticeably more attractive.
In light of this, it's curious that China TianYF Holdings Group's P/S sits in line with the majority of other companies. Apparently some shareholders believe the recent performance is at its limits and have been accepting lower selling prices.
What Does China TianYF Holdings Group's P/S Mean For Investors?
With its share price dropping off a cliff, the P/S for China TianYF Holdings Group looks to be in line with the rest of the Trade Distributors industry. Using the price-to-sales ratio alone to determine if you should sell your stock isn't sensible, however it can be a practical guide to the company's future prospects.
To our surprise, China TianYF Holdings Group revealed its three-year revenue trends aren't contributing to its P/S as much as we would have predicted, given they look better than current industry expectations. It'd be fair to assume that potential risks the company faces could be the contributing factor to the lower than expected P/S. While recent revenue trends over the past medium-term suggest that the risk of a price decline is low, investors appear to see the likelihood of revenue fluctuations in the future.
And what about other risks? Every company has them, and we've spotted 3 warning signs for China TianYF Holdings Group (of which 1 is potentially serious!) you should know about.
Of course, profitable companies with a history of great earnings growth are generally safer bets. So you may wish to see this free collection of other companies that have reasonable P/E ratios and have grown earnings strongly.
New: AI Stock Screener & Alerts
Our new AI Stock Screener scans the market every day to uncover opportunities.
• Dividend Powerhouses (3%+ Yield)
• Undervalued Small Caps with Insider Buying
• High growth Tech and AI Companies
Or build your own from over 50 metrics.
Have feedback on this article? Concerned about the content? Get in touch with us directly. Alternatively, email editorial-team (at) simplywallst.com.
This article by Simply Wall St is general in nature. We provide commentary based on historical data and analyst forecasts only using an unbiased methodology and our articles are not intended to be financial advice. It does not constitute a recommendation to buy or sell any stock, and does not take account of your objectives, or your financial situation. We aim to bring you long-term focused analysis driven by fundamental data. Note that our analysis may not factor in the latest price-sensitive company announcements or qualitative material. Simply Wall St has no position in any stocks mentioned.
About SEHK:8196
Futian Holdings
An investment holding company, engages in the provision of engineering services for wastewater and drinking water treatment facilities in Mainland China and Vietnam.
Flawless balance sheet low.
Market Insights

Advertisement
Community Narratives
WhiteCap Is Positioned To Profit Regardless Of Trump's Policy 
Fair Value CA$22.60|61.5% undervalued
ST
Equity Analyst and Writer
Microsoft's Evolution Will Drive Revenue to New Heights Fueled by AI
Fair Value US$360.00|30.7% overvalued
BR
Community Contributor
A CASE FOR USD$2.50 (CAD$3.44) BY 2028 (A 5-10 BAGGER)
Fair Value CA$3.44|88.1% undervalued
AG
Community Contributor