
Advertisement
Legendary fund manager Li Lu (who Charlie Munger backed) once said, 'The biggest investment risk is not the volatility of prices, but whether you will suffer a permanent loss of capital.' When we think about how risky a company is, we always like to look at its use of debt, since debt overload can lead to ruin. We can see that Global Strategic Group Limited (HKG:8007) does use debt in its business. But is this debt a concern to shareholders?
What Risk Does Debt Bring?
Debt is a tool to help businesses grow, but if a business is incapable of paying off its lenders, then it exists at their mercy. In the worst case scenario, a company can go bankrupt if it cannot pay its creditors. However, a more frequent (but still costly) occurrence is where a company must issue shares at bargain-basement prices, permanently diluting shareholders, just to shore up its balance sheet. By replacing dilution, though, debt can be an extremely good tool for businesses that need capital to invest in growth at high rates of return. The first step when considering a company's debt levels is to consider its cash and debt together.
View our latest analysis for Global Strategic Group
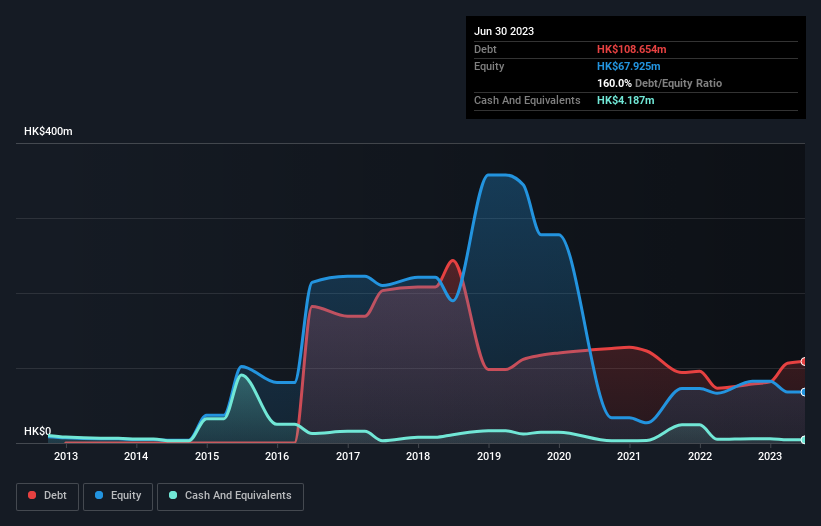
What Is Global Strategic Group's Net Debt?
The image below, which you can click on for greater detail, shows that at March 2023 Global Strategic Group had debt of HK$108.7m, up from HK$73.0m in one year. However, it does have HK$4.19m in cash offsetting this, leading to net debt of about HK$104.5m.
How Healthy Is Global Strategic Group's Balance Sheet?
According to the last reported balance sheet, Global Strategic Group had liabilities of HK$109.9m due within 12 months, and liabilities of HK$83.8m due beyond 12 months. On the other hand, it had cash of HK$4.19m and HK$25.9m worth of receivables due within a year. So its liabilities outweigh the sum of its cash and (near-term) receivables by HK$163.6m.
Given this deficit is actually higher than the company's market capitalization of HK$132.2m, we think shareholders really should watch Global Strategic Group's debt levels, like a parent watching their child ride a bike for the first time. Hypothetically, extremely heavy dilution would be required if the company were forced to pay down its liabilities by raising capital at the current share price. When analysing debt levels, the balance sheet is the obvious place to start. But you can't view debt in total isolation; since Global Strategic Group will need earnings to service that debt. So when considering debt, it's definitely worth looking at the earnings trend. Click here for an interactive snapshot.
In the last year Global Strategic Group wasn't profitable at an EBIT level, but managed to grow its revenue by 18%, to HK$153m. We usually like to see faster growth from unprofitable companies, but each to their own.
Caveat Emptor
Over the last twelve months Global Strategic Group produced an earnings before interest and tax (EBIT) loss. Its EBIT loss was a whopping HK$25m. Considering that alongside the liabilities mentioned above make us nervous about the company. We'd want to see some strong near-term improvements before getting too interested in the stock. Not least because it burned through HK$15m in negative free cash flow over the last year. So suffice it to say we consider the stock to be risky. There's no doubt that we learn most about debt from the balance sheet. However, not all investment risk resides within the balance sheet - far from it. Be aware that Global Strategic Group is showing 3 warning signs in our investment analysis , and 1 of those is concerning...
Of course, if you're the type of investor who prefers buying stocks without the burden of debt, then don't hesitate to discover our exclusive list of net cash growth stocks, today.
New: Manage All Your Stock Portfolios in One Place
We've created the ultimate portfolio companion for stock investors, and it's free.
• Connect an unlimited number of Portfolios and see your total in one currency
• Be alerted to new Warning Signs or Risks via email or mobile
• Track the Fair Value of your stocks
Have feedback on this article? Concerned about the content? Get in touch with us directly. Alternatively, email editorial-team (at) simplywallst.com.
This article by Simply Wall St is general in nature. We provide commentary based on historical data and analyst forecasts only using an unbiased methodology and our articles are not intended to be financial advice. It does not constitute a recommendation to buy or sell any stock, and does not take account of your objectives, or your financial situation. We aim to bring you long-term focused analysis driven by fundamental data. Note that our analysis may not factor in the latest price-sensitive company announcements or qualitative material. Simply Wall St has no position in any stocks mentioned.
About SEHK:8007
Global Strategic Group
An investment holding company, supplies natural gas in the People’s Republic of China.
Slightly overvalued with very low risk.
Market Insights

Advertisement
Community Narratives
MicroVision will explode future revenue by 380.37% with a vision towards success
Fair Value US$60|98.4% undervalued
TH
Community Contributor
The Indispensable Artery for a New North American Economy
Fair Value CA$132.87|0.6% undervalued
TI
Community Contributor
Recently Updated Narratives
BL


BlackGoat on Alphabet ·
Alphabet: The Under-appreciated Compounder Hiding in Plain Sight
Fair Value:US$324.481.3% undervalued
75 followersusers have followed this narrative
3 commentsusers have commented on this narrative
1 likeusers have liked this narrative
BE


Bejgal on MINISO Group Holding ·
MINISO's fair value is projected at 26.69 with an anticipated PE ratio shift of 20x
Fair Value:US$26.6926.7% undervalued
44 followersusers have followed this narrative
3 commentsusers have commented on this narrative
0 likesusers have liked this narrative
TI


TickerTickle on Oracle ·
The Quiet Giant That Became AI’s Power Grid
Fair Value:US$389.8147.4% undervalued
9 followersusers have followed this narrative
1 commentusers have commented on this narrative
0 likesusers have liked this narrative
Popular Narratives
OS

oscargarcia on Alphabet ·
The company that turned a verb into a global necessity and basically runs the modern internet, digital ads, smartphones, maps, and AI.
Fair Value:US$3405.9% undervalued
136 followersusers have followed this narrative
6 commentsusers have commented on this narrative
18 likesusers have liked this narrative
TH

TheWallstreetKing on MicroVision ·
MicroVision will explode future revenue by 380.37% with a vision towards success
Fair Value:US$6098.4% undervalued
89 followersusers have followed this narrative
10 commentsusers have commented on this narrative
18 likesusers have liked this narrative
AN


AnalystConsensusTarget on NVIDIA ·
NVDA: Expanding AI Demand Will Drive Major Data Center Investments Through 2026
Fair Value:US$232.7922.6% undervalued
926 followersusers have followed this narrative
6 commentsusers have commented on this narrative
22 likesusers have liked this narrative