

David Iben put it well when he said, 'Volatility is not a risk we care about. What we care about is avoiding the permanent loss of capital.' When we think about how risky a company is, we always like to look at its use of debt, since debt overload can lead to ruin. We note that Tysan Holdings Limited (HKG:687) does have debt on its balance sheet. But should shareholders be worried about its use of debt?
When Is Debt A Problem?
Debt assists a business until the business has trouble paying it off, either with new capital or with free cash flow. Ultimately, if the company can't fulfill its legal obligations to repay debt, shareholders could walk away with nothing. While that is not too common, we often do see indebted companies permanently diluting shareholders because lenders force them to raise capital at a distressed price. By replacing dilution, though, debt can be an extremely good tool for businesses that need capital to invest in growth at high rates of return. The first thing to do when considering how much debt a business uses is to look at its cash and debt together.
See our latest analysis for Tysan Holdings
How Much Debt Does Tysan Holdings Carry?
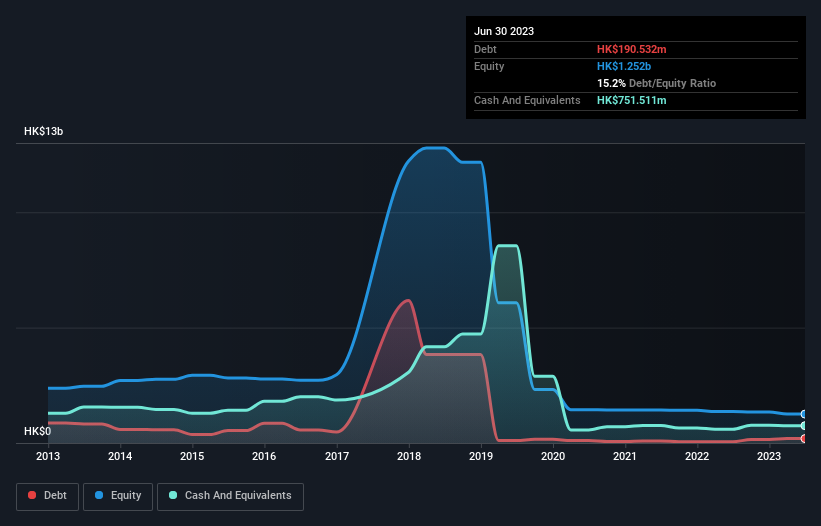
The image below, which you can click on for greater detail, shows that at June 2023 Tysan Holdings had debt of HK$190.5m, up from HK$55.2m in one year. However, its balance sheet shows it holds HK$751.5m in cash, so it actually has HK$561.0m net cash.
How Strong Is Tysan Holdings' Balance Sheet?
Zooming in on the latest balance sheet data, we can see that Tysan Holdings had liabilities of HK$798.4m due within 12 months and liabilities of HK$132.5m due beyond that. Offsetting these obligations, it had cash of HK$751.5m as well as receivables valued at HK$992.5m due within 12 months. So it can boast HK$813.1m more liquid assets than total liabilities.
This surplus liquidity suggests that Tysan Holdings' balance sheet could take a hit just as well as Homer Simpson's head can take a punch. With this in mind one could posit that its balance sheet means the company is able to handle some adversity. Succinctly put, Tysan Holdings boasts net cash, so it's fair to say it does not have a heavy debt load! When analysing debt levels, the balance sheet is the obvious place to start. But you can't view debt in total isolation; since Tysan Holdings will need earnings to service that debt. So if you're keen to discover more about its earnings, it might be worth checking out this graph of its long term earnings trend.
Over 12 months, Tysan Holdings reported revenue of HK$2.9b, which is a gain of 36%, although it did not report any earnings before interest and tax. With any luck the company will be able to grow its way to profitability.
So How Risky Is Tysan Holdings?
Although Tysan Holdings had an earnings before interest and tax (EBIT) loss over the last twelve months, it generated positive free cash flow of HK$54m. So although it is loss-making, it doesn't seem to have too much near-term balance sheet risk, keeping in mind the net cash. We also take heart from the solid 36% revenue growth in 12 months; undoubtedly a good sign. That growth could mean this is one stock well worth watching. For riskier companies like Tysan Holdings I always like to keep an eye on the long term profit and revenue trends. Fortunately, you can click to see our interactive graph of its profit, revenue, and operating cashflow.
If you're interested in investing in businesses that can grow profits without the burden of debt, then check out this free list of growing businesses that have net cash on the balance sheet.
If you're looking to trade Tysan Holdings, open an account with the lowest-cost platform trusted by professionals, Interactive Brokers.
With clients in over 200 countries and territories, and access to 160 markets, IBKR lets you trade stocks, options, futures, forex, bonds and funds from a single integrated account.
Enjoy no hidden fees, no account minimums, and FX conversion rates as low as 0.03%, far better than what most brokers offer.
Sponsored ContentValuation is complex, but we're here to simplify it.
Discover if Tysan Holdings might be undervalued or overvalued with our detailed analysis, featuring fair value estimates, potential risks, dividends, insider trades, and its financial condition.
Access Free AnalysisHave feedback on this article? Concerned about the content? Get in touch with us directly. Alternatively, email editorial-team (at) simplywallst.com.
This article by Simply Wall St is general in nature. We provide commentary based on historical data and analyst forecasts only using an unbiased methodology and our articles are not intended to be financial advice. It does not constitute a recommendation to buy or sell any stock, and does not take account of your objectives, or your financial situation. We aim to bring you long-term focused analysis driven by fundamental data. Note that our analysis may not factor in the latest price-sensitive company announcements or qualitative material. Simply Wall St has no position in any stocks mentioned.
About SEHK:687
Tysan Holdings
An investment holding company, provides foundation piling and site investigation services in Hong Kong.
Excellent balance sheet with acceptable track record.
Market Insights

Community Narratives

