Gemilang International Limited's (HKG:6163) Popularity With Investors Under Threat As Stock Sinks 25%


Gemilang International Limited (HKG:6163) shares have retraced a considerable 25% in the last month, reversing a fair amount of their solid recent performance. Longer-term, the stock has been solid despite a difficult 30 days, gaining 13% in the last year.
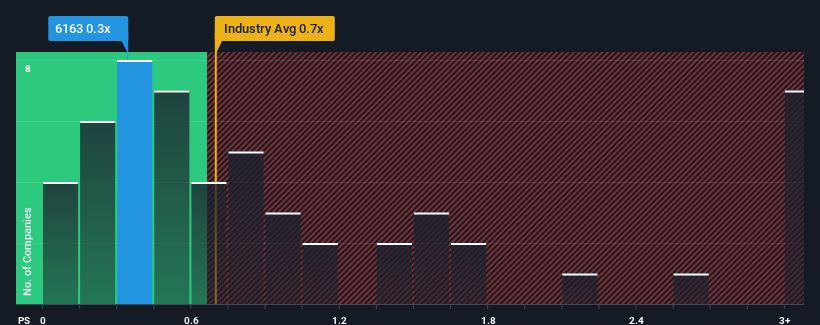
Even after such a large drop in price, it's still not a stretch to say that Gemilang International's price-to-sales (or "P/S") ratio of 0.3x right now seems quite "middle-of-the-road" compared to the Machinery industry in Hong Kong, where the median P/S ratio is around 0.7x. Although, it's not wise to simply ignore the P/S without explanation as investors may be disregarding a distinct opportunity or a costly mistake.
Check out our latest analysis for Gemilang International
What Does Gemilang International's Recent Performance Look Like?
Recent times have been quite advantageous for Gemilang International as its revenue has been rising very briskly. Perhaps the market is expecting future revenue performance to taper off, which has kept the P/S from rising. Those who are bullish on Gemilang International will be hoping that this isn't the case, so that they can pick up the stock at a lower valuation.
Want the full picture on earnings, revenue and cash flow for the company? Then our free report on Gemilang International will help you shine a light on its historical performance.Is There Some Revenue Growth Forecasted For Gemilang International?
Gemilang International's P/S ratio would be typical for a company that's only expected to deliver moderate growth, and importantly, perform in line with the industry.
Retrospectively, the last year delivered an exceptional 61% gain to the company's top line. However, this wasn't enough as the latest three year period has seen the company endure a nasty 32% drop in revenue in aggregate. Therefore, it's fair to say the revenue growth recently has been undesirable for the company.
Comparing that to the industry, which is predicted to deliver 15% growth in the next 12 months, the company's downward momentum based on recent medium-term revenue results is a sobering picture.
With this information, we find it concerning that Gemilang International is trading at a fairly similar P/S compared to the industry. It seems most investors are ignoring the recent poor growth rate and are hoping for a turnaround in the company's business prospects. Only the boldest would assume these prices are sustainable as a continuation of recent revenue trends is likely to weigh on the share price eventually.
The Final Word
Following Gemilang International's share price tumble, its P/S is just clinging on to the industry median P/S. We'd say the price-to-sales ratio's power isn't primarily as a valuation instrument but rather to gauge current investor sentiment and future expectations.
We find it unexpected that Gemilang International trades at a P/S ratio that is comparable to the rest of the industry, despite experiencing declining revenues during the medium-term, while the industry as a whole is expected to grow. When we see revenue heading backwards in the context of growing industry forecasts, it'd make sense to expect a possible share price decline on the horizon, sending the moderate P/S lower. Unless the recent medium-term conditions improve markedly, investors will have a hard time accepting the share price as fair value.
Having said that, be aware Gemilang International is showing 4 warning signs in our investment analysis, you should know about.
If strong companies turning a profit tickle your fancy, then you'll want to check out this free list of interesting companies that trade on a low P/E (but have proven they can grow earnings).
New: Manage All Your Stock Portfolios in One Place
We've created the ultimate portfolio companion for stock investors, and it's free.
• Connect an unlimited number of Portfolios and see your total in one currency
• Be alerted to new Warning Signs or Risks via email or mobile
• Track the Fair Value of your stocks
Have feedback on this article? Concerned about the content? Get in touch with us directly. Alternatively, email editorial-team (at) simplywallst.com.
This article by Simply Wall St is general in nature. We provide commentary based on historical data and analyst forecasts only using an unbiased methodology and our articles are not intended to be financial advice. It does not constitute a recommendation to buy or sell any stock, and does not take account of your objectives, or your financial situation. We aim to bring you long-term focused analysis driven by fundamental data. Note that our analysis may not factor in the latest price-sensitive company announcements or qualitative material. Simply Wall St has no position in any stocks mentioned.
About SEHK:6163
Gemilang International
An investment holding company, engages in the design, manufacture, and sale of bus bodies in Malaysia and Singapore.
Slight and slightly overvalued.
Market Insights

Community Narratives

