- Hong Kong
- /
- Trade Distributors
- /
- SEHK:599
The Returns On Capital At E. Bon Holdings (HKG:599) Don't Inspire Confidence


What financial metrics can indicate to us that a company is maturing or even in decline? More often than not, we'll see a declining return on capital employed (ROCE) and a declining amount of capital employed. This indicates the company is producing less profit from its investments and its total assets are decreasing. Having said that, after a brief look, E. Bon Holdings (HKG:599) we aren't filled with optimism, but let's investigate further.
What Is Return On Capital Employed (ROCE)?
Just to clarify if you're unsure, ROCE is a metric for evaluating how much pre-tax income (in percentage terms) a company earns on the capital invested in its business. To calculate this metric for E. Bon Holdings, this is the formula:
Return on Capital Employed = Earnings Before Interest and Tax (EBIT) ÷ (Total Assets - Current Liabilities)
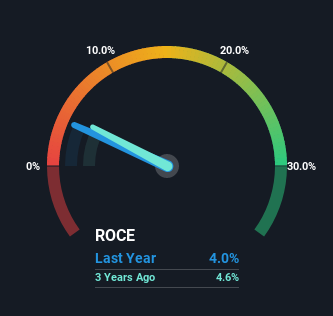
0.04 = HK$21m ÷ (HK$702m - HK$186m) (Based on the trailing twelve months to March 2022).
So, E. Bon Holdings has an ROCE of 4.0%. Even though it's in line with the industry average of 4.1%, it's still a low return by itself.
View our latest analysis for E. Bon Holdings
While the past is not representative of the future, it can be helpful to know how a company has performed historically, which is why we have this chart above. If you want to delve into the historical earnings, revenue and cash flow of E. Bon Holdings, check out these free graphs here.
So How Is E. Bon Holdings' ROCE Trending?
We are a bit worried about the trend of returns on capital at E. Bon Holdings. To be more specific, the ROCE was 10% five years ago, but since then it has dropped noticeably. And on the capital employed front, the business is utilizing roughly the same amount of capital as it was back then. Since returns are falling and the business has the same amount of assets employed, this can suggest it's a mature business that hasn't had much growth in the last five years. If these trends continue, we wouldn't expect E. Bon Holdings to turn into a multi-bagger.
Our Take On E. Bon Holdings' ROCE
In the end, the trend of lower returns on the same amount of capital isn't typically an indication that we're looking at a growth stock. It should come as no surprise then that the stock has fallen 64% over the last five years, so it looks like investors are recognizing these changes. Unless there is a shift to a more positive trajectory in these metrics, we would look elsewhere.
Since virtually every company faces some risks, it's worth knowing what they are, and we've spotted 4 warning signs for E. Bon Holdings (of which 1 can't be ignored!) that you should know about.
While E. Bon Holdings may not currently earn the highest returns, we've compiled a list of companies that currently earn more than 25% return on equity. Check out this free list here.
If you're looking to trade E. Bon Holdings, open an account with the lowest-cost platform trusted by professionals, Interactive Brokers.
With clients in over 200 countries and territories, and access to 160 markets, IBKR lets you trade stocks, options, futures, forex, bonds and funds from a single integrated account.
Enjoy no hidden fees, no account minimums, and FX conversion rates as low as 0.03%, far better than what most brokers offer.
Sponsored ContentValuation is complex, but we're here to simplify it.
Discover if E. Bon Holdings might be undervalued or overvalued with our detailed analysis, featuring fair value estimates, potential risks, dividends, insider trades, and its financial condition.
Access Free AnalysisHave feedback on this article? Concerned about the content? Get in touch with us directly. Alternatively, email editorial-team (at) simplywallst.com.
This article by Simply Wall St is general in nature. We provide commentary based on historical data and analyst forecasts only using an unbiased methodology and our articles are not intended to be financial advice. It does not constitute a recommendation to buy or sell any stock, and does not take account of your objectives, or your financial situation. We aim to bring you long-term focused analysis driven by fundamental data. Note that our analysis may not factor in the latest price-sensitive company announcements or qualitative material. Simply Wall St has no position in any stocks mentioned.
About SEHK:599
E. Bon Holdings
An investment holding company, engages in the importing, wholesale, retail and installation of architectural builders’ hardware, bathroom, kitchen collections, and furniture in the Hong Kong and the People’s Republic of China.
Flawless balance sheet with acceptable track record.
Market Insights

Community Narratives

