
Advertisement
- Hong Kong
- /
- Trade Distributors
- /
- SEHK:521
CWT International (HKG:521) Has A Somewhat Strained Balance Sheet
Legendary fund manager Li Lu (who Charlie Munger backed) once said, 'The biggest investment risk is not the volatility of prices, but whether you will suffer a permanent loss of capital.' When we think about how risky a company is, we always like to look at its use of debt, since debt overload can lead to ruin. Importantly, CWT International Limited (HKG:521) does carry debt. But should shareholders be worried about its use of debt?
When Is Debt Dangerous?
Debt assists a business until the business has trouble paying it off, either with new capital or with free cash flow. Ultimately, if the company can't fulfill its legal obligations to repay debt, shareholders could walk away with nothing. However, a more usual (but still expensive) situation is where a company must dilute shareholders at a cheap share price simply to get debt under control. Of course, plenty of companies use debt to fund growth, without any negative consequences. The first step when considering a company's debt levels is to consider its cash and debt together.
How Much Debt Does CWT International Carry?
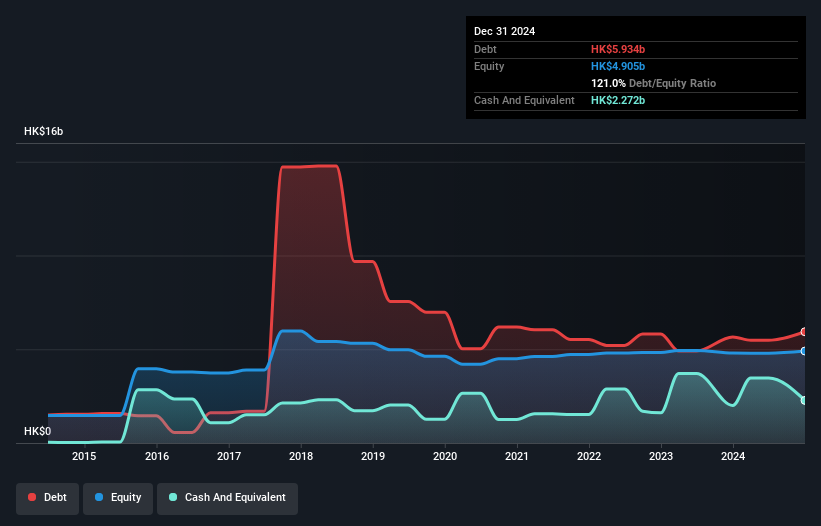
The image below, which you can click on for greater detail, shows that at December 2024 CWT International had debt of HK$5.93b, up from HK$5.65b in one year. However, because it has a cash reserve of HK$2.27b, its net debt is less, at about HK$3.66b.
How Strong Is CWT International's Balance Sheet?
We can see from the most recent balance sheet that CWT International had liabilities of HK$19.8b falling due within a year, and liabilities of HK$2.94b due beyond that. On the other hand, it had cash of HK$2.27b and HK$3.50b worth of receivables due within a year. So it has liabilities totalling HK$17.0b more than its cash and near-term receivables, combined.
This deficit casts a shadow over the HK$1.53b company, like a colossus towering over mere mortals. So we'd watch its balance sheet closely, without a doubt. After all, CWT International would likely require a major re-capitalisation if it had to pay its creditors today.
Check out our latest analysis for CWT International
We use two main ratios to inform us about debt levels relative to earnings. The first is net debt divided by earnings before interest, tax, depreciation, and amortization (EBITDA), while the second is how many times its earnings before interest and tax (EBIT) covers its interest expense (or its interest cover, for short). The advantage of this approach is that we take into account both the absolute quantum of debt (with net debt to EBITDA) and the actual interest expenses associated with that debt (with its interest cover ratio).
As it happens CWT International has a fairly concerning net debt to EBITDA ratio of 5.1 but very strong interest coverage of 1k. This means that unless the company has access to very cheap debt, that interest expense will likely grow in the future. We note that CWT International grew its EBIT by 22% in the last year, and that should make it easier to pay down debt, going forward. There's no doubt that we learn most about debt from the balance sheet. But you can't view debt in total isolation; since CWT International will need earnings to service that debt. So when considering debt, it's definitely worth looking at the earnings trend. Click here for an interactive snapshot.
But our final consideration is also important, because a company cannot pay debt with paper profits; it needs cold hard cash. So the logical step is to look at the proportion of that EBIT that is matched by actual free cash flow. Over the last three years, CWT International actually produced more free cash flow than EBIT. That sort of strong cash generation warms our hearts like a puppy in a bumblebee suit.
Our View
We feel some trepidation about CWT International's difficulty level of total liabilities, but we've got positives to focus on, too. To wit both its interest cover and conversion of EBIT to free cash flow were encouraging signs. We think that CWT International's debt does make it a bit risky, after considering the aforementioned data points together. That's not necessarily a bad thing, since leverage can boost returns on equity, but it is something to be aware of. The balance sheet is clearly the area to focus on when you are analysing debt. However, not all investment risk resides within the balance sheet - far from it. For example, we've discovered 2 warning signs for CWT International (1 is potentially serious!) that you should be aware of before investing here.
If you're interested in investing in businesses that can grow profits without the burden of debt, then check out this free list of growing businesses that have net cash on the balance sheet.
New: AI Stock Screener & Alerts
Our new AI Stock Screener scans the market every day to uncover opportunities.
• Dividend Powerhouses (3%+ Yield)
• Undervalued Small Caps with Insider Buying
• High growth Tech and AI Companies
Or build your own from over 50 metrics.
Have feedback on this article? Concerned about the content? Get in touch with us directly. Alternatively, email editorial-team (at) simplywallst.com.
This article by Simply Wall St is general in nature. We provide commentary based on historical data and analyst forecasts only using an unbiased methodology and our articles are not intended to be financial advice. It does not constitute a recommendation to buy or sell any stock, and does not take account of your objectives, or your financial situation. We aim to bring you long-term focused analysis driven by fundamental data. Note that our analysis may not factor in the latest price-sensitive company announcements or qualitative material. Simply Wall St has no position in any stocks mentioned.
About SEHK:521
CWT International
An investment holding company, provides logistics, commodity marketing, engineering, and financial services in Mainland China, rest of the Asia Pacific Region, the United States, Europe, and Africa.
Proven track record with mediocre balance sheet.
Market Insights

Advertisement
Community Narratives
MINISO's fair value is projected at 26.69 with an anticipated PE ratio shift of 20x
Fair Value US$24.03|11.0% undervalued
BE
Community Contributor
Procter & Gamble: A Dividend Giant Facing Slowing Growth
Fair Value US$119.81|23.3% overvalued
AN
Community Contributor
Eli Lilly's Future Growth Driven by Tirzepatide and Favorable Market Conditions
Fair Value US$1.19k|13.8% undervalued
EA
Community Contributor