
Advertisement
- Hong Kong
- /
- Electrical
- /
- SEHK:3919
Here's What's Concerning About Golden Power Group Holdings' (HKG:3919) Returns On Capital

To find a multi-bagger stock, what are the underlying trends we should look for in a business? Firstly, we'll want to see a proven return on capital employed (ROCE) that is increasing, and secondly, an expanding base of capital employed. Basically this means that a company has profitable initiatives that it can continue to reinvest in, which is a trait of a compounding machine. In light of that, when we looked at Golden Power Group Holdings (HKG:3919) and its ROCE trend, we weren't exactly thrilled.
Return On Capital Employed (ROCE): What Is It?
For those who don't know, ROCE is a measure of a company's yearly pre-tax profit (its return), relative to the capital employed in the business. To calculate this metric for Golden Power Group Holdings, this is the formula:
Return on Capital Employed = Earnings Before Interest and Tax (EBIT) ÷ (Total Assets - Current Liabilities)
0.0096 = HK$3.3m ÷ (HK$690m - HK$345m) (Based on the trailing twelve months to June 2022).
So, Golden Power Group Holdings has an ROCE of 1.0%. In absolute terms, that's a low return and it also under-performs the Electrical industry average of 6.2%.
Check out our latest analysis for Golden Power Group Holdings
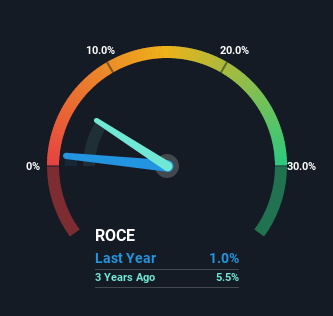
Historical performance is a great place to start when researching a stock so above you can see the gauge for Golden Power Group Holdings' ROCE against it's prior returns. If you'd like to look at how Golden Power Group Holdings has performed in the past in other metrics, you can view this free graph of past earnings, revenue and cash flow.
So How Is Golden Power Group Holdings' ROCE Trending?
On the surface, the trend of ROCE at Golden Power Group Holdings doesn't inspire confidence. To be more specific, ROCE has fallen from 15% over the last five years. Meanwhile, the business is utilizing more capital but this hasn't moved the needle much in terms of sales in the past 12 months, so this could reflect longer term investments. It may take some time before the company starts to see any change in earnings from these investments.
While on the subject, we noticed that the ratio of current liabilities to total assets has risen to 50%, which has impacted the ROCE. If current liabilities hadn't increased as much as they did, the ROCE could actually be even lower. And with current liabilities at these levels, suppliers or short-term creditors are effectively funding a large part of the business, which can introduce some risks.
The Bottom Line
In summary, Golden Power Group Holdings is reinvesting funds back into the business for growth but unfortunately it looks like sales haven't increased much just yet. It seems that investors have little hope of these trends getting any better and that may have partly contributed to the stock collapsing 86% in the last five years. On the whole, we aren't too inspired by the underlying trends and we think there may be better chances of finding a multi-bagger elsewhere.
One more thing to note, we've identified 3 warning signs with Golden Power Group Holdings and understanding these should be part of your investment process.
If you want to search for solid companies with great earnings, check out this free list of companies with good balance sheets and impressive returns on equity.
New: Manage All Your Stock Portfolios in One Place
We've created the ultimate portfolio companion for stock investors, and it's free.
• Connect an unlimited number of Portfolios and see your total in one currency
• Be alerted to new Warning Signs or Risks via email or mobile
• Track the Fair Value of your stocks
Have feedback on this article? Concerned about the content? Get in touch with us directly. Alternatively, email editorial-team (at) simplywallst.com.
This article by Simply Wall St is general in nature. We provide commentary based on historical data and analyst forecasts only using an unbiased methodology and our articles are not intended to be financial advice. It does not constitute a recommendation to buy or sell any stock, and does not take account of your objectives, or your financial situation. We aim to bring you long-term focused analysis driven by fundamental data. Note that our analysis may not factor in the latest price-sensitive company announcements or qualitative material. Simply Wall St has no position in any stocks mentioned.
About SEHK:3919
Golden Power Group Holdings
An investment holding company, engages in the manufacture and sale batteries for various electronic devices in the People’s Republic of China, Hong Kong, and internationally.
Moderate and good value.
Market Insights


Advertisement
Community Narratives
MicroStrategy: Volatile Gamble or Golden Opportunity?
Fair Value US$663.00|33.3% undervalued
BL
Community Contributor
Emerging Markets and Debt Reduction Will Propel Bath & Body Works Forward
Fair Value US$40.73|23.4% undervalued
ZW
Community Contributor
An amazing opportunity to potentially get a 100 bagger
Fair Value US$10.00|8.5% overvalued
DA
Community Contributor