
Advertisement
RENHENG Enterprise Holdings Limited's (HKG:3628) Shares Climb 28% But Its Business Is Yet to Catch Up

RENHENG Enterprise Holdings Limited (HKG:3628) shareholders are no doubt pleased to see that the share price has bounced 28% in the last month, although it is still struggling to make up recently lost ground. Looking back a bit further, it's encouraging to see the stock is up 28% in the last year.
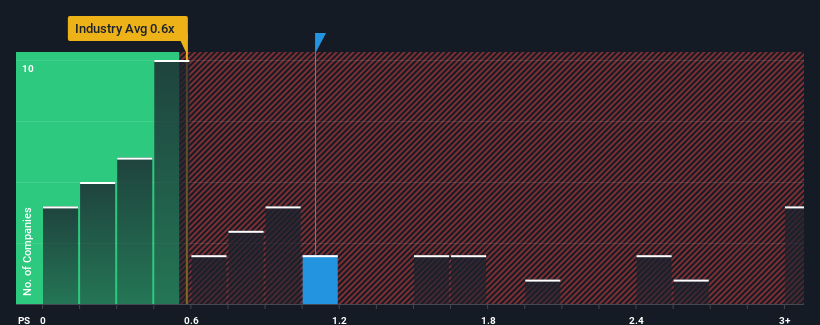
Following the firm bounce in price, when almost half of the companies in Hong Kong's Machinery industry have price-to-sales ratios (or "P/S") below 0.6x, you may consider RENHENG Enterprise Holdings as a stock probably not worth researching with its 1.1x P/S ratio. Nonetheless, we'd need to dig a little deeper to determine if there is a rational basis for the elevated P/S.
View our latest analysis for RENHENG Enterprise Holdings
How Has RENHENG Enterprise Holdings Performed Recently?
The revenue growth achieved at RENHENG Enterprise Holdings over the last year would be more than acceptable for most companies. It might be that many expect the respectable revenue performance to beat most other companies over the coming period, which has increased investors’ willingness to pay up for the stock. You'd really hope so, otherwise you're paying a pretty hefty price for no particular reason.
Although there are no analyst estimates available for RENHENG Enterprise Holdings, take a look at this free data-rich visualisation to see how the company stacks up on earnings, revenue and cash flow.What Are Revenue Growth Metrics Telling Us About The High P/S?
In order to justify its P/S ratio, RENHENG Enterprise Holdings would need to produce impressive growth in excess of the industry.
Retrospectively, the last year delivered an exceptional 29% gain to the company's top line. Pleasingly, revenue has also lifted 42% in aggregate from three years ago, thanks to the last 12 months of growth. So we can start by confirming that the company has done a great job of growing revenue over that time.
Comparing that to the industry, which is predicted to deliver 12% growth in the next 12 months, the company's momentum is pretty similar based on recent medium-term annualised revenue results.
In light of this, it's curious that RENHENG Enterprise Holdings' P/S sits above the majority of other companies. Apparently many investors in the company are more bullish than recent times would indicate and aren't willing to let go of their stock right now. Nevertheless, they may be setting themselves up for future disappointment if the P/S falls to levels more in line with recent growth rates.
The Bottom Line On RENHENG Enterprise Holdings' P/S
The large bounce in RENHENG Enterprise Holdings' shares has lifted the company's P/S handsomely. Generally, our preference is to limit the use of the price-to-sales ratio to establishing what the market thinks about the overall health of a company.
Our examination of RENHENG Enterprise Holdings revealed its three-year revenue trends aren't impacting its high P/S as much as we would have predicted, given they look similar to current industry expectations. Right now we are uncomfortable with the high P/S as this revenue performance isn't likely to support such positive sentiment for long. If recent medium-term revenue trends continue, it will place shareholders' investments at risk and potential investors in danger of paying an unnecessary premium.
Before you take the next step, you should know about the 2 warning signs for RENHENG Enterprise Holdings (1 is a bit unpleasant!) that we have uncovered.
If you're unsure about the strength of RENHENG Enterprise Holdings' business, why not explore our interactive list of stocks with solid business fundamentals for some other companies you may have missed.
New: AI Stock Screener & Alerts
Our new AI Stock Screener scans the market every day to uncover opportunities.
• Dividend Powerhouses (3%+ Yield)
• Undervalued Small Caps with Insider Buying
• High growth Tech and AI Companies
Or build your own from over 50 metrics.
Have feedback on this article? Concerned about the content? Get in touch with us directly. Alternatively, email editorial-team (at) simplywallst.com.
This article by Simply Wall St is general in nature. We provide commentary based on historical data and analyst forecasts only using an unbiased methodology and our articles are not intended to be financial advice. It does not constitute a recommendation to buy or sell any stock, and does not take account of your objectives, or your financial situation. We aim to bring you long-term focused analysis driven by fundamental data. Note that our analysis may not factor in the latest price-sensitive company announcements or qualitative material. Simply Wall St has no position in any stocks mentioned.
About SEHK:3628
RENHENG Enterprise Holdings
An investment holding company, engages in the manufacture and sale of tobacco machinery products in the People’s Republic of China.
Flawless balance sheet low.
Market Insights


Advertisement
Community Narratives
Alphabet: The Under-appreciated Compounder Hiding in Plain Sight
Fair Value US$282.83|31.8% undervalued
BL
Community Contributor
Planet Labs: At The Heart Of The Emerging New Space Boom
Fair Value US$11.31|44.7% undervalued
AN
Community Contributor
Exxon in Guyana 5 year forecast Low $135 to High $189
Fair Value US$189.00|40.9% undervalued
AG
Community Contributor