
Advertisement
TK Group (Holdings) (HKG:2283) Might Be Having Difficulty Using Its Capital Effectively
Did you know there are some financial metrics that can provide clues of a potential multi-bagger? Typically, we'll want to notice a trend of growing return on capital employed (ROCE) and alongside that, an expanding base of capital employed. Ultimately, this demonstrates that it's a business that is reinvesting profits at increasing rates of return. Although, when we looked at TK Group (Holdings) (HKG:2283), it didn't seem to tick all of these boxes.
Understanding Return On Capital Employed (ROCE)
For those who don't know, ROCE is a measure of a company's yearly pre-tax profit (its return), relative to the capital employed in the business. The formula for this calculation on TK Group (Holdings) is:
Return on Capital Employed = Earnings Before Interest and Tax (EBIT) ÷ (Total Assets - Current Liabilities)
0.16 = HK$295m ÷ (HK$2.9b - HK$964m) (Based on the trailing twelve months to December 2021).
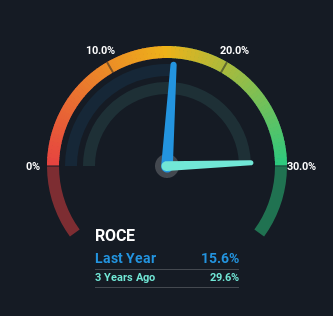
So, TK Group (Holdings) has an ROCE of 16%. In absolute terms, that's a satisfactory return, but compared to the Machinery industry average of 8.8% it's much better.
Check out our latest analysis for TK Group (Holdings)
Above you can see how the current ROCE for TK Group (Holdings) compares to its prior returns on capital, but there's only so much you can tell from the past. If you're interested, you can view the analysts predictions in our free report on analyst forecasts for the company.
The Trend Of ROCE
In terms of TK Group (Holdings)'s historical ROCE movements, the trend isn't fantastic. To be more specific, ROCE has fallen from 29% over the last five years. However, given capital employed and revenue have both increased it appears that the business is currently pursuing growth, at the consequence of short term returns. And if the increased capital generates additional returns, the business, and thus shareholders, will benefit in the long run.
On a side note, TK Group (Holdings) has done well to pay down its current liabilities to 34% of total assets. That could partly explain why the ROCE has dropped. Effectively this means their suppliers or short-term creditors are funding less of the business, which reduces some elements of risk. Some would claim this reduces the business' efficiency at generating ROCE since it is now funding more of the operations with its own money.
The Bottom Line On TK Group (Holdings)'s ROCE
Even though returns on capital have fallen in the short term, we find it promising that revenue and capital employed have both increased for TK Group (Holdings). These growth trends haven't led to growth returns though, since the stock has fallen 34% over the last five years. So we think it'd be worthwhile to look further into this stock given the trends look encouraging.
Like most companies, TK Group (Holdings) does come with some risks, and we've found 1 warning sign that you should be aware of.
If you want to search for solid companies with great earnings, check out this free list of companies with good balance sheets and impressive returns on equity.
Valuation is complex, but we're here to simplify it.
Discover if TK Group (Holdings) might be undervalued or overvalued with our detailed analysis, featuring fair value estimates, potential risks, dividends, insider trades, and its financial condition.
Access Free AnalysisHave feedback on this article? Concerned about the content? Get in touch with us directly. Alternatively, email editorial-team (at) simplywallst.com.
This article by Simply Wall St is general in nature. We provide commentary based on historical data and analyst forecasts only using an unbiased methodology and our articles are not intended to be financial advice. It does not constitute a recommendation to buy or sell any stock, and does not take account of your objectives, or your financial situation. We aim to bring you long-term focused analysis driven by fundamental data. Note that our analysis may not factor in the latest price-sensitive company announcements or qualitative material. Simply Wall St has no position in any stocks mentioned.
About SEHK:2283
TK Group (Holdings)
An investment holding company, engages in the manufacture, sale, subcontracting, fabrication, and modification of molds and plastic components.
Flawless balance sheet, undervalued and pays a dividend.
Market Insights

Advertisement
Community Narratives
Kodiak AI - a potential 100 bagger opportunity?
Fair Value US$14.00|41.9% undervalued
DA
Community Contributor
A Fair Price for a Great Business Facing Real Threats
Fair Value US$383.06|14.1% undervalued
IM
Community Contributor
AXON And Shopify Integration Will Unlock Global Mobile Advertising
Fair Value US$613.59|1.3% undervalued
AN
Based on Analyst Price Targets