- Hong Kong
- /
- Trade Distributors
- /
- SEHK:223
What Elife Holdings Limited's (HKG:223) 30% Share Price Gain Is Not Telling You


Elife Holdings Limited (HKG:223) shares have had a really impressive month, gaining 30% after a shaky period beforehand. The annual gain comes to 239% following the latest surge, making investors sit up and take notice.
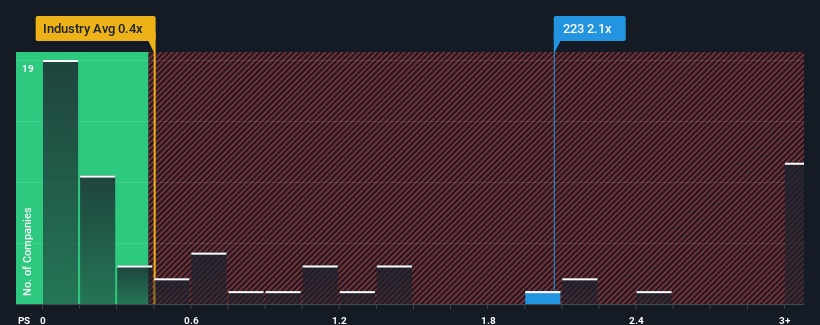
Since its price has surged higher, you could be forgiven for thinking Elife Holdings is a stock not worth researching with a price-to-sales ratios (or "P/S") of 2.1x, considering almost half the companies in Hong Kong's Trade Distributors industry have P/S ratios below 0.4x. Nonetheless, we'd need to dig a little deeper to determine if there is a rational basis for the elevated P/S.
View our latest analysis for Elife Holdings
What Does Elife Holdings' Recent Performance Look Like?
For example, consider that Elife Holdings' financial performance has been pretty ordinary lately as revenue growth is non-existent. One possibility is that the P/S is high because investors think the benign revenue growth will improve to outperform the broader industry in the near future. You'd really hope so, otherwise you're paying a pretty hefty price for no particular reason.
Want the full picture on earnings, revenue and cash flow for the company? Then our free report on Elife Holdings will help you shine a light on its historical performance.What Are Revenue Growth Metrics Telling Us About The High P/S?
The only time you'd be truly comfortable seeing a P/S as high as Elife Holdings' is when the company's growth is on track to outshine the industry.
Taking a look back first, we see that there was hardly any revenue growth to speak of for the company over the past year. Fortunately, a few good years before that means that it was still able to grow revenue by 26% in total over the last three years. Accordingly, shareholders probably wouldn't have been overly satisfied with the unstable medium-term growth rates.
Comparing that to the industry, which is predicted to deliver 23% growth in the next 12 months, the company's momentum is weaker, based on recent medium-term annualised revenue results.
With this in mind, we find it worrying that Elife Holdings' P/S exceeds that of its industry peers. Apparently many investors in the company are way more bullish than recent times would indicate and aren't willing to let go of their stock at any price. Only the boldest would assume these prices are sustainable as a continuation of recent revenue trends is likely to weigh heavily on the share price eventually.
What Does Elife Holdings' P/S Mean For Investors?
Elife Holdings' P/S is on the rise since its shares have risen strongly. We'd say the price-to-sales ratio's power isn't primarily as a valuation instrument but rather to gauge current investor sentiment and future expectations.
The fact that Elife Holdings currently trades on a higher P/S relative to the industry is an oddity, since its recent three-year growth is lower than the wider industry forecast. Right now we aren't comfortable with the high P/S as this revenue performance isn't likely to support such positive sentiment for long. If recent medium-term revenue trends continue, it will place shareholders' investments at significant risk and potential investors in danger of paying an excessive premium.
We don't want to rain on the parade too much, but we did also find 3 warning signs for Elife Holdings (2 are concerning!) that you need to be mindful of.
If strong companies turning a profit tickle your fancy, then you'll want to check out this free list of interesting companies that trade on a low P/E (but have proven they can grow earnings).
Valuation is complex, but we're here to simplify it.
Discover if Elife Holdings might be undervalued or overvalued with our detailed analysis, featuring fair value estimates, potential risks, dividends, insider trades, and its financial condition.
Access Free AnalysisHave feedback on this article? Concerned about the content? Get in touch with us directly. Alternatively, email editorial-team (at) simplywallst.com.
This article by Simply Wall St is general in nature. We provide commentary based on historical data and analyst forecasts only using an unbiased methodology and our articles are not intended to be financial advice. It does not constitute a recommendation to buy or sell any stock, and does not take account of your objectives, or your financial situation. We aim to bring you long-term focused analysis driven by fundamental data. Note that our analysis may not factor in the latest price-sensitive company announcements or qualitative material. Simply Wall St has no position in any stocks mentioned.
About SEHK:223
Elife Holdings
An investment holding company, engages in the supply chain business for branded goods and consumer products in Hong Kong and the People’s Republic of China.
Adequate balance sheet slight.
Market Insights

Community Narratives


