- Hong Kong
- /
- Trade Distributors
- /
- SEHK:223
The Price Is Right For Elife Holdings Limited (HKG:223) Even After Diving 33%


The Elife Holdings Limited (HKG:223) share price has softened a substantial 33% over the previous 30 days, handing back much of the gains the stock has made lately. Of course, over the longer-term many would still wish they owned shares as the stock's price has soared 113% in the last twelve months.
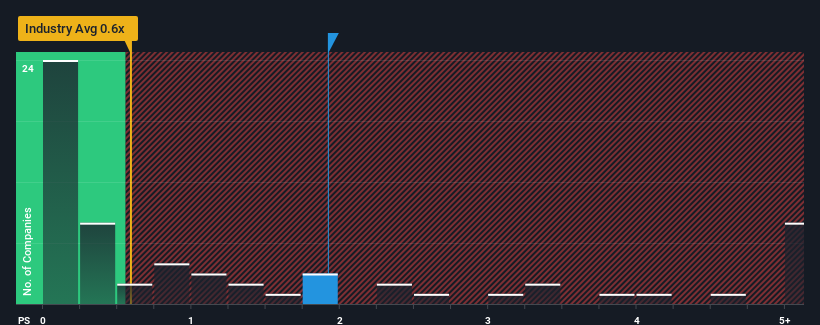
Even after such a large drop in price, you could still be forgiven for thinking Elife Holdings is a stock not worth researching with a price-to-sales ratios (or "P/S") of 1.9x, considering almost half the companies in Hong Kong's Trade Distributors industry have P/S ratios below 0.6x. Nonetheless, we'd need to dig a little deeper to determine if there is a rational basis for the elevated P/S.
View our latest analysis for Elife Holdings
What Does Elife Holdings' Recent Performance Look Like?
It looks like revenue growth has deserted Elife Holdings recently, which is not something to boast about. It might be that many are expecting an improvement to the uninspiring revenue performance over the coming period, which has kept the P/S from collapsing. If not, then existing shareholders may be a little nervous about the viability of the share price.
Although there are no analyst estimates available for Elife Holdings, take a look at this free data-rich visualisation to see how the company stacks up on earnings, revenue and cash flow.What Are Revenue Growth Metrics Telling Us About The High P/S?
In order to justify its P/S ratio, Elife Holdings would need to produce impressive growth in excess of the industry.
Taking a look back first, we see that there was hardly any revenue growth to speak of for the company over the past year. Regardless, revenue has managed to lift by a handy 26% in aggregate from three years ago, thanks to the earlier period of growth. So it appears to us that the company has had a mixed result in terms of growing revenue over that time.
When compared to the industry's one-year growth forecast of 3.3%, the most recent medium-term revenue trajectory is noticeably more alluring
In light of this, it's understandable that Elife Holdings' P/S sits above the majority of other companies. Presumably shareholders aren't keen to offload something they believe will continue to outmanoeuvre the wider industry.
The Bottom Line On Elife Holdings' P/S
There's still some elevation in Elife Holdings' P/S, even if the same can't be said for its share price recently. Typically, we'd caution against reading too much into price-to-sales ratios when settling on investment decisions, though it can reveal plenty about what other market participants think about the company.
It's no surprise that Elife Holdings can support its high P/S given the strong revenue growth its experienced over the last three-year is superior to the current industry outlook. Right now shareholders are comfortable with the P/S as they are quite confident revenue aren't under threat. Unless the recent medium-term conditions change, they will continue to provide strong support to the share price.
We don't want to rain on the parade too much, but we did also find 3 warning signs for Elife Holdings (1 can't be ignored!) that you need to be mindful of.
Of course, profitable companies with a history of great earnings growth are generally safer bets. So you may wish to see this free collection of other companies that have reasonable P/E ratios and have grown earnings strongly.
If you're looking to trade Elife Holdings, open an account with the lowest-cost platform trusted by professionals, Interactive Brokers.
With clients in over 200 countries and territories, and access to 160 markets, IBKR lets you trade stocks, options, futures, forex, bonds and funds from a single integrated account.
Enjoy no hidden fees, no account minimums, and FX conversion rates as low as 0.03%, far better than what most brokers offer.
Sponsored ContentValuation is complex, but we're here to simplify it.
Discover if Elife Holdings might be undervalued or overvalued with our detailed analysis, featuring fair value estimates, potential risks, dividends, insider trades, and its financial condition.
Access Free AnalysisHave feedback on this article? Concerned about the content? Get in touch with us directly. Alternatively, email editorial-team (at) simplywallst.com.
This article by Simply Wall St is general in nature. We provide commentary based on historical data and analyst forecasts only using an unbiased methodology and our articles are not intended to be financial advice. It does not constitute a recommendation to buy or sell any stock, and does not take account of your objectives, or your financial situation. We aim to bring you long-term focused analysis driven by fundamental data. Note that our analysis may not factor in the latest price-sensitive company announcements or qualitative material. Simply Wall St has no position in any stocks mentioned.
About SEHK:223
Elife Holdings
An investment holding company, engages in the supply chain business for branded goods and consumer products in Hong Kong and the People’s Republic of China.
Adequate balance sheet slight.
Market Insights

Community Narratives

