
Advertisement
- Hong Kong
- /
- Trade Distributors
- /
- SEHK:223
Elife Holdings Limited's (HKG:223) 26% Share Price Plunge Could Signal Some Risk

The Elife Holdings Limited (HKG:223) share price has softened a substantial 26% over the previous 30 days, handing back much of the gains the stock has made lately. Looking at the bigger picture, even after this poor month the stock is up 80% in the last year.
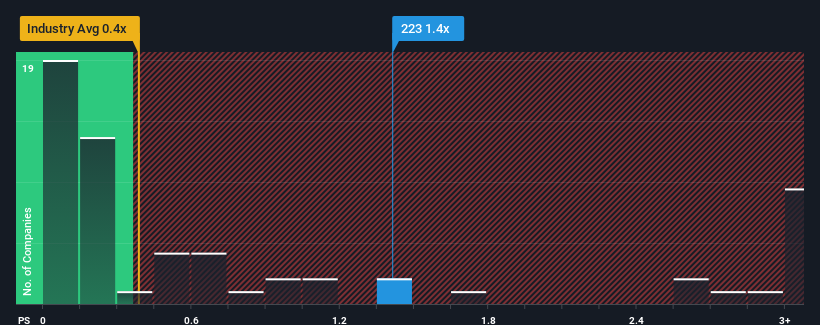
Even after such a large drop in price, given close to half the companies operating in Hong Kong's Trade Distributors industry have price-to-sales ratios (or "P/S") below 0.4x, you may still consider Elife Holdings as a stock to potentially avoid with its 1.4x P/S ratio. Although, it's not wise to just take the P/S at face value as there may be an explanation why it's as high as it is.
View our latest analysis for Elife Holdings
How Has Elife Holdings Performed Recently?
For example, consider that Elife Holdings' financial performance has been poor lately as its revenue has been in decline. One possibility is that the P/S is high because investors think the company will still do enough to outperform the broader industry in the near future. If not, then existing shareholders may be quite nervous about the viability of the share price.
We don't have analyst forecasts, but you can see how recent trends are setting up the company for the future by checking out our free report on Elife Holdings' earnings, revenue and cash flow.How Is Elife Holdings' Revenue Growth Trending?
In order to justify its P/S ratio, Elife Holdings would need to produce impressive growth in excess of the industry.
Retrospectively, the last year delivered a frustrating 23% decrease to the company's top line. This means it has also seen a slide in revenue over the longer-term as revenue is down 33% in total over the last three years. Accordingly, shareholders would have felt downbeat about the medium-term rates of revenue growth.
Comparing that to the industry, which is predicted to deliver 33% growth in the next 12 months, the company's downward momentum based on recent medium-term revenue results is a sobering picture.
With this in mind, we find it worrying that Elife Holdings' P/S exceeds that of its industry peers. Apparently many investors in the company are way more bullish than recent times would indicate and aren't willing to let go of their stock at any price. There's a very good chance existing shareholders are setting themselves up for future disappointment if the P/S falls to levels more in line with the recent negative growth rates.
What Does Elife Holdings' P/S Mean For Investors?
There's still some elevation in Elife Holdings' P/S, even if the same can't be said for its share price recently. We'd say the price-to-sales ratio's power isn't primarily as a valuation instrument but rather to gauge current investor sentiment and future expectations.
We've established that Elife Holdings currently trades on a much higher than expected P/S since its recent revenues have been in decline over the medium-term. With a revenue decline on investors' minds, the likelihood of a souring sentiment is quite high which could send the P/S back in line with what we'd expect. Unless the the circumstances surrounding the recent medium-term improve, it wouldn't be wrong to expect a a difficult period ahead for the company's shareholders.
Before you take the next step, you should know about the 4 warning signs for Elife Holdings (2 can't be ignored!) that we have uncovered.
It's important to make sure you look for a great company, not just the first idea you come across. So if growing profitability aligns with your idea of a great company, take a peek at this free list of interesting companies with strong recent earnings growth (and a low P/E).
Valuation is complex, but we're here to simplify it.
Discover if Elife Holdings might be undervalued or overvalued with our detailed analysis, featuring fair value estimates, potential risks, dividends, insider trades, and its financial condition.
Access Free AnalysisHave feedback on this article? Concerned about the content? Get in touch with us directly. Alternatively, email editorial-team (at) simplywallst.com.
This article by Simply Wall St is general in nature. We provide commentary based on historical data and analyst forecasts only using an unbiased methodology and our articles are not intended to be financial advice. It does not constitute a recommendation to buy or sell any stock, and does not take account of your objectives, or your financial situation. We aim to bring you long-term focused analysis driven by fundamental data. Note that our analysis may not factor in the latest price-sensitive company announcements or qualitative material. Simply Wall St has no position in any stocks mentioned.
Have feedback on this article? Concerned about the content? Get in touch with us directly. Alternatively, email editorial-team@simplywallst.com
About SEHK:223
Elife Holdings
An investment holding company, engages in the supply chain business for branded goods and consumer products in Hong Kong and the People’s Republic of China.
Adequate balance sheet slight.
Market Insights

Advertisement
Community Narratives
Groundbreaking therapies that could change the treatment landscape for PTSD, fibromyalgia, MS & Alzheimer’s
Fair Value US$6.20|86.8% undervalued
CM
Community Contributor
DigitalOcean Will Grow 14% by Embracing AI with Paperspace Acquisition
Fair Value US$50.00|43.5% undervalued
NE
Community Contributor
Viant Technology: A Rising AdTech Challenger in the AI-Powered CTV Market
Fair Value US$38.61|61.4% undervalued
BL
Community Contributor
Volvo will Accelerate Forward into Electric and Autonomous Leadership in Five Years
Fair Value SEK 438.80|40.9% undervalued
UN
Community Contributor