- Hong Kong
- /
- Construction
- /
- SEHK:1741
What Shing Chi Holdings Limited's (HKG:1741) 29% Share Price Gain Is Not Telling You


Those holding Shing Chi Holdings Limited (HKG:1741) shares would be relieved that the share price has rebounded 29% in the last thirty days, but it needs to keep going to repair the recent damage it has caused to investor portfolios. But the last month did very little to improve the 95% share price decline over the last year.
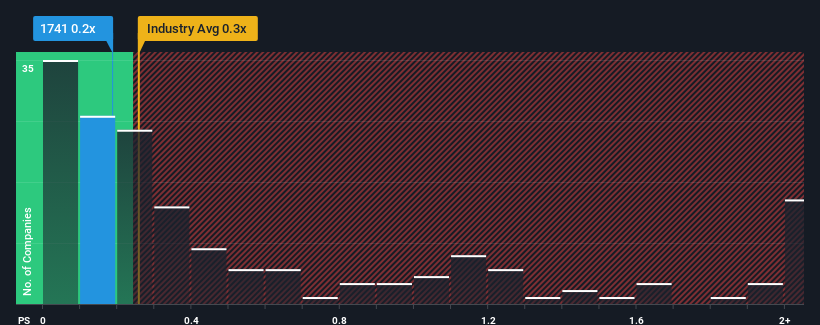
Even after such a large jump in price, it's still not a stretch to say that Shing Chi Holdings' price-to-sales (or "P/S") ratio of 0.2x right now seems quite "middle-of-the-road" compared to the Construction industry in Hong Kong, where the median P/S ratio is around 0.3x. While this might not raise any eyebrows, if the P/S ratio is not justified investors could be missing out on a potential opportunity or ignoring looming disappointment.
View our latest analysis for Shing Chi Holdings
How Has Shing Chi Holdings Performed Recently?
Shing Chi Holdings certainly has been doing a great job lately as it's been growing its revenue at a really rapid pace. The P/S is probably moderate because investors think this strong revenue growth might not be enough to outperform the broader industry in the near future. Those who are bullish on Shing Chi Holdings will be hoping that this isn't the case, so that they can pick up the stock at a lower valuation.
We don't have analyst forecasts, but you can see how recent trends are setting up the company for the future by checking out our free report on Shing Chi Holdings' earnings, revenue and cash flow.Do Revenue Forecasts Match The P/S Ratio?
The only time you'd be comfortable seeing a P/S like Shing Chi Holdings' is when the company's growth is tracking the industry closely.
Retrospectively, the last year delivered an exceptional 63% gain to the company's top line. Despite this strong recent growth, it's still struggling to catch up as its three-year revenue frustratingly shrank by 5.9% overall. Therefore, it's fair to say the revenue growth recently has been undesirable for the company.
In contrast to the company, the rest of the industry is expected to grow by 9.9% over the next year, which really puts the company's recent medium-term revenue decline into perspective.
In light of this, it's somewhat alarming that Shing Chi Holdings' P/S sits in line with the majority of other companies. Apparently many investors in the company are way less bearish than recent times would indicate and aren't willing to let go of their stock right now. There's a good chance existing shareholders are setting themselves up for future disappointment if the P/S falls to levels more in line with the recent negative growth rates.
What Does Shing Chi Holdings' P/S Mean For Investors?
Shing Chi Holdings appears to be back in favour with a solid price jump bringing its P/S back in line with other companies in the industry We'd say the price-to-sales ratio's power isn't primarily as a valuation instrument but rather to gauge current investor sentiment and future expectations.
We find it unexpected that Shing Chi Holdings trades at a P/S ratio that is comparable to the rest of the industry, despite experiencing declining revenues during the medium-term, while the industry as a whole is expected to grow. Even though it matches the industry, we're uncomfortable with the current P/S ratio, as this dismal revenue performance is unlikely to support a more positive sentiment for long. Unless the recent medium-term conditions improve markedly, investors will have a hard time accepting the share price as fair value.
Plus, you should also learn about these 3 warning signs we've spotted with Shing Chi Holdings (including 2 which are concerning).
Of course, profitable companies with a history of great earnings growth are generally safer bets. So you may wish to see this free collection of other companies that have reasonable P/E ratios and have grown earnings strongly.
If you're looking to trade Shing Chi Holdings, open an account with the lowest-cost platform trusted by professionals, Interactive Brokers.
With clients in over 200 countries and territories, and access to 160 markets, IBKR lets you trade stocks, options, futures, forex, bonds and funds from a single integrated account.
Enjoy no hidden fees, no account minimums, and FX conversion rates as low as 0.03%, far better than what most brokers offer.
Sponsored ContentNew: Manage All Your Stock Portfolios in One Place
We've created the ultimate portfolio companion for stock investors, and it's free.
• Connect an unlimited number of Portfolios and see your total in one currency
• Be alerted to new Warning Signs or Risks via email or mobile
• Track the Fair Value of your stocks
Have feedback on this article? Concerned about the content? Get in touch with us directly. Alternatively, email editorial-team (at) simplywallst.com.
This article by Simply Wall St is general in nature. We provide commentary based on historical data and analyst forecasts only using an unbiased methodology and our articles are not intended to be financial advice. It does not constitute a recommendation to buy or sell any stock, and does not take account of your objectives, or your financial situation. We aim to bring you long-term focused analysis driven by fundamental data. Note that our analysis may not factor in the latest price-sensitive company announcements or qualitative material. Simply Wall St has no position in any stocks mentioned.
About SEHK:1741
Shing Chi Holdings
An investment holding company, operates as a construction contractor in Hong Kong.
Flawless balance sheet low.
Market Insights

Community Narratives

