
Advertisement
- Hong Kong
- /
- Construction
- /
- SEHK:1741
More Unpleasant Surprises Could Be In Store For Ri Ying Holdings Limited's (HKG:1741) Shares After Tumbling 27%
Unfortunately for some shareholders, the Ri Ying Holdings Limited (HKG:1741) share price has dived 27% in the last thirty days, prolonging recent pain. The recent drop completes a disastrous twelve months for shareholders, who are sitting on a 73% loss during that time.
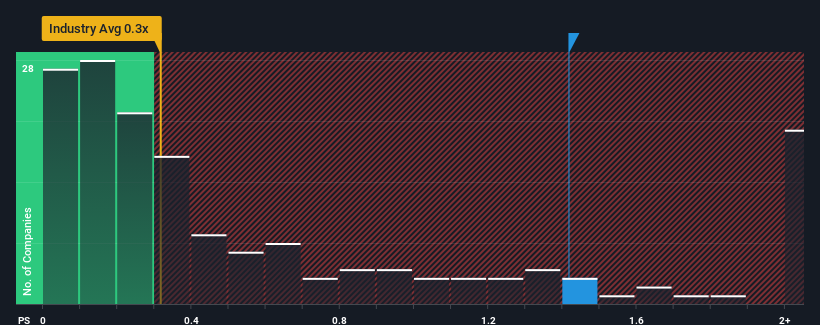
Even after such a large drop in price, when almost half of the companies in Hong Kong's Construction industry have price-to-sales ratios (or "P/S") below 0.3x, you may still consider Ri Ying Holdings as a stock probably not worth researching with its 1.4x P/S ratio. Nonetheless, we'd need to dig a little deeper to determine if there is a rational basis for the elevated P/S.
Check out our latest analysis for Ri Ying Holdings
What Does Ri Ying Holdings' P/S Mean For Shareholders?
Ri Ying Holdings certainly has been doing a great job lately as it's been growing its revenue at a really rapid pace. Perhaps the market is expecting future revenue performance to outperform the wider market, which has seemingly got people interested in the stock. You'd really hope so, otherwise you're paying a pretty hefty price for no particular reason.
Want the full picture on earnings, revenue and cash flow for the company? Then our free report on Ri Ying Holdings will help you shine a light on its historical performance.Do Revenue Forecasts Match The High P/S Ratio?
The only time you'd be truly comfortable seeing a P/S as high as Ri Ying Holdings' is when the company's growth is on track to outshine the industry.
Taking a look back first, we see that the company grew revenue by an impressive 105% last year. Despite this strong recent growth, it's still struggling to catch up as its three-year revenue frustratingly shrank by 26% overall. Therefore, it's fair to say the revenue growth recently has been undesirable for the company.
Weighing that medium-term revenue trajectory against the broader industry's one-year forecast for expansion of 9.5% shows it's an unpleasant look.
With this information, we find it concerning that Ri Ying Holdings is trading at a P/S higher than the industry. Apparently many investors in the company are way more bullish than recent times would indicate and aren't willing to let go of their stock at any price. There's a very good chance existing shareholders are setting themselves up for future disappointment if the P/S falls to levels more in line with the recent negative growth rates.
The Final Word
Despite the recent share price weakness, Ri Ying Holdings' P/S remains higher than most other companies in the industry. We'd say the price-to-sales ratio's power isn't primarily as a valuation instrument but rather to gauge current investor sentiment and future expectations.
Our examination of Ri Ying Holdings revealed its shrinking revenue over the medium-term isn't resulting in a P/S as low as we expected, given the industry is set to grow. Right now we aren't comfortable with the high P/S as this revenue performance is highly unlikely to support such positive sentiment for long. Should recent medium-term revenue trends persist, it would pose a significant risk to existing shareholders' investments and prospective investors will have a hard time accepting the current value of the stock.
You should always think about risks. Case in point, we've spotted 4 warning signs for Ri Ying Holdings you should be aware of, and 2 of them can't be ignored.
If you're unsure about the strength of Ri Ying Holdings' business, why not explore our interactive list of stocks with solid business fundamentals for some other companies you may have missed.
New: Manage All Your Stock Portfolios in One Place
We've created the ultimate portfolio companion for stock investors, and it's free.
• Connect an unlimited number of Portfolios and see your total in one currency
• Be alerted to new Warning Signs or Risks via email or mobile
• Track the Fair Value of your stocks
Have feedback on this article? Concerned about the content? Get in touch with us directly. Alternatively, email editorial-team (at) simplywallst.com.
This article by Simply Wall St is general in nature. We provide commentary based on historical data and analyst forecasts only using an unbiased methodology and our articles are not intended to be financial advice. It does not constitute a recommendation to buy or sell any stock, and does not take account of your objectives, or your financial situation. We aim to bring you long-term focused analysis driven by fundamental data. Note that our analysis may not factor in the latest price-sensitive company announcements or qualitative material. Simply Wall St has no position in any stocks mentioned.
About SEHK:1741
Shing Chi Holdings
An investment holding company, operates as a construction contractor in Hong Kong.
Flawless balance sheet and slightly overvalued.
Market Insights


Advertisement
Community Narratives
The Next Phase of Defense AI: A Robotic Response to America’s Security Gaps
Fair Value US$12.00|54.3% undervalued
MA
Community Contributor
Figma (FIG): The S&P 500’s Design Standard Turning Into an All-in-One Platform
Fair Value US$65.70|7.2% overvalued
TI
Community Contributor
Sleep Cycle's Revenue Set to Rise 10% with Strong Revenue Model
Fair Value SEK 38.04|25.3% undervalued
MA
Community Contributor
Has JB Hi-Fi Lost Its Point of Difference?
Fair Value AU$76.00|51.4% overvalued
RO
Community Contributor