- Hong Kong
- /
- Electrical
- /
- SEHK:1729
Market Participants Recognise Time Interconnect Technology Limited's (HKG:1729) Earnings Pushing Shares 34% Higher
Time Interconnect Technology Limited (HKG:1729) shares have had a really impressive month, gaining 34% after a shaky period beforehand. The last month tops off a massive increase of 282% in the last year.
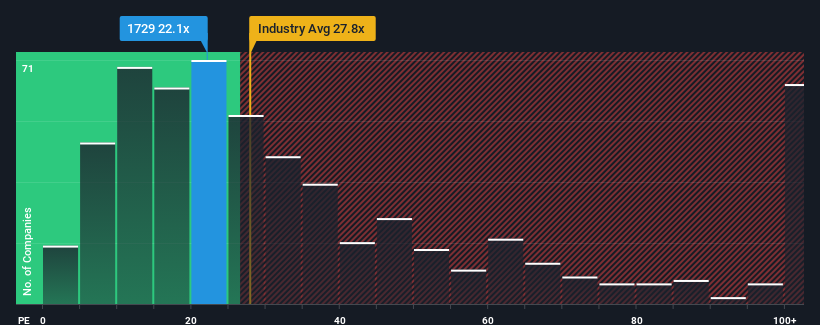
After such a large jump in price, Time Interconnect Technology's price-to-earnings (or "P/E") ratio of 22.1x might make it look like a strong sell right now compared to the market in Hong Kong, where around half of the companies have P/E ratios below 10x and even P/E's below 6x are quite common. However, the P/E might be quite high for a reason and it requires further investigation to determine if it's justified.
Recent times have been quite advantageous for Time Interconnect Technology as its earnings have been rising very briskly. It seems that many are expecting the strong earnings performance to beat most other companies over the coming period, which has increased investors’ willingness to pay up for the stock. You'd really hope so, otherwise you're paying a pretty hefty price for no particular reason.
View our latest analysis for Time Interconnect Technology

Is There Enough Growth For Time Interconnect Technology?
The only time you'd be truly comfortable seeing a P/E as steep as Time Interconnect Technology's is when the company's growth is on track to outshine the market decidedly.
If we review the last year of earnings growth, the company posted a terrific increase of 72%. The latest three year period has also seen an excellent 92% overall rise in EPS, aided by its short-term performance. So we can start by confirming that the company has done a great job of growing earnings over that time.
Weighing that recent medium-term earnings trajectory against the broader market's one-year forecast for expansion of 22% shows it's noticeably more attractive on an annualised basis.
With this information, we can see why Time Interconnect Technology is trading at such a high P/E compared to the market. Presumably shareholders aren't keen to offload something they believe will continue to outmanoeuvre the bourse.
What We Can Learn From Time Interconnect Technology's P/E?
Time Interconnect Technology's P/E is flying high just like its stock has during the last month. Using the price-to-earnings ratio alone to determine if you should sell your stock isn't sensible, however it can be a practical guide to the company's future prospects.
As we suspected, our examination of Time Interconnect Technology revealed its three-year earnings trends are contributing to its high P/E, given they look better than current market expectations. At this stage investors feel the potential for a deterioration in earnings isn't great enough to justify a lower P/E ratio. If recent medium-term earnings trends continue, it's hard to see the share price falling strongly in the near future under these circumstances.
Before you take the next step, you should know about the 1 warning sign for Time Interconnect Technology that we have uncovered.
It's important to make sure you look for a great company, not just the first idea you come across. So take a peek at this free list of interesting companies with strong recent earnings growth (and a low P/E).
Valuation is complex, but we're here to simplify it.
Discover if Time Interconnect Technology might be undervalued or overvalued with our detailed analysis, featuring fair value estimates, potential risks, dividends, insider trades, and its financial condition.
Access Free AnalysisHave feedback on this article? Concerned about the content? Get in touch with us directly. Alternatively, email editorial-team (at) simplywallst.com.
This article by Simply Wall St is general in nature. We provide commentary based on historical data and analyst forecasts only using an unbiased methodology and our articles are not intended to be financial advice. It does not constitute a recommendation to buy or sell any stock, and does not take account of your objectives, or your financial situation. We aim to bring you long-term focused analysis driven by fundamental data. Note that our analysis may not factor in the latest price-sensitive company announcements or qualitative material. Simply Wall St has no position in any stocks mentioned.
About SEHK:1729
Time Interconnect Technology
An investment holding company, manufactures and sells cable assembly, digital cable, and server products in the People's Republic of China, the United States, Singapore, the Netherlands, Hong Kong, Mexico, the United Kingdom, and internationally.
Exceptional growth potential with excellent balance sheet.
Market Insights
Community Narratives


