
Advertisement
- Hong Kong
- /
- Construction
- /
- SEHK:1630
These Return Metrics Don't Make Kin Shing Holdings (HKG:1630) Look Too Strong

Ignoring the stock price of a company, what are the underlying trends that tell us a business is past the growth phase? When we see a declining return on capital employed (ROCE) in conjunction with a declining base of capital employed, that's often how a mature business shows signs of aging. Basically the company is earning less on its investments and it is also reducing its total assets. And from a first read, things don't look too good at Kin Shing Holdings (HKG:1630), so let's see why.
Understanding Return On Capital Employed (ROCE)
For those who don't know, ROCE is a measure of a company's yearly pre-tax profit (its return), relative to the capital employed in the business. Analysts use this formula to calculate it for Kin Shing Holdings:
Return on Capital Employed = Earnings Before Interest and Tax (EBIT) ÷ (Total Assets - Current Liabilities)
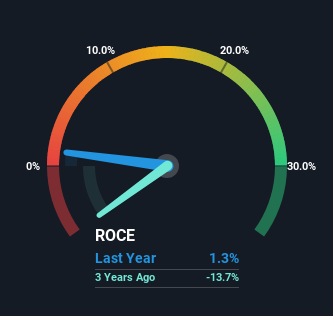
0.013 = HK$2.0m ÷ (HK$491m - HK$331m) (Based on the trailing twelve months to September 2023).
So, Kin Shing Holdings has an ROCE of 1.3%. In absolute terms, that's a low return and it also under-performs the Construction industry average of 7.8%.
Check out our latest analysis for Kin Shing Holdings
While the past is not representative of the future, it can be helpful to know how a company has performed historically, which is why we have this chart above. If you'd like to look at how Kin Shing Holdings has performed in the past in other metrics, you can view this free graph of Kin Shing Holdings' past earnings, revenue and cash flow.
How Are Returns Trending?
There is reason to be cautious about Kin Shing Holdings, given the returns are trending downwards. To be more specific, the ROCE was 14% five years ago, but since then it has dropped noticeably. On top of that, it's worth noting that the amount of capital employed within the business has remained relatively steady. Since returns are falling and the business has the same amount of assets employed, this can suggest it's a mature business that hasn't had much growth in the last five years. So because these trends aren't typically conducive to creating a multi-bagger, we wouldn't hold our breath on Kin Shing Holdings becoming one if things continue as they have.
On a separate but related note, it's important to know that Kin Shing Holdings has a current liabilities to total assets ratio of 67%, which we'd consider pretty high. This can bring about some risks because the company is basically operating with a rather large reliance on its suppliers or other sorts of short-term creditors. While it's not necessarily a bad thing, it can be beneficial if this ratio is lower.
The Key Takeaway
In summary, it's unfortunate that Kin Shing Holdings is generating lower returns from the same amount of capital. Unsurprisingly then, the stock has dived 83% over the last five years, so investors are recognizing these changes and don't like the company's prospects. With underlying trends that aren't great in these areas, we'd consider looking elsewhere.
On a final note, we found 3 warning signs for Kin Shing Holdings (1 is concerning) you should be aware of.
If you want to search for solid companies with great earnings, check out this free list of companies with good balance sheets and impressive returns on equity.
Valuation is complex, but we're here to simplify it.
Discover if Kin Shing Holdings might be undervalued or overvalued with our detailed analysis, featuring fair value estimates, potential risks, dividends, insider trades, and its financial condition.
Access Free AnalysisHave feedback on this article? Concerned about the content? Get in touch with us directly. Alternatively, email editorial-team (at) simplywallst.com.
This article by Simply Wall St is general in nature. We provide commentary based on historical data and analyst forecasts only using an unbiased methodology and our articles are not intended to be financial advice. It does not constitute a recommendation to buy or sell any stock, and does not take account of your objectives, or your financial situation. We aim to bring you long-term focused analysis driven by fundamental data. Note that our analysis may not factor in the latest price-sensitive company announcements or qualitative material. Simply Wall St has no position in any stocks mentioned.
About SEHK:1630
Kin Shing Holdings
An investment holding company, engages in erecting formworks for construction works in private residential and commercial buildings in Hong Kong.
Mediocre balance sheet and slightly overvalued.
Market Insights

Advertisement
Community Narratives
Groundbreaking therapies that could change the treatment landscape for PTSD, fibromyalgia, MS & Alzheimer’s
Fair Value US$6.20|86.9% undervalued
CM
Community Contributor
DigitalOcean Will Grow 14% by Embracing AI with Paperspace Acquisition
Fair Value US$50.00|41.7% undervalued
NE
Community Contributor
Viant Technology: A Rising AdTech Challenger in the AI-Powered CTV Market
Fair Value US$38.61|63.2% undervalued
BL
Community Contributor
Volvo will Accelerate Forward into Electric and Autonomous Leadership in Five Years
Fair Value SEK 438.80|39.7% undervalued
UN
Community Contributor