- Hong Kong
- /
- Construction
- /
- SEHK:1615
Returns On Capital At AB Builders Group (HKG:1615) Paint A Concerning Picture


What are the early trends we should look for to identify a stock that could multiply in value over the long term? Amongst other things, we'll want to see two things; firstly, a growing return on capital employed (ROCE) and secondly, an expansion in the company's amount of capital employed. Ultimately, this demonstrates that it's a business that is reinvesting profits at increasing rates of return. Although, when we looked at AB Builders Group (HKG:1615), it didn't seem to tick all of these boxes.
Return On Capital Employed (ROCE): What Is It?
If you haven't worked with ROCE before, it measures the 'return' (pre-tax profit) a company generates from capital employed in its business. The formula for this calculation on AB Builders Group is:
Return on Capital Employed = Earnings Before Interest and Tax (EBIT) ÷ (Total Assets - Current Liabilities)
0.016 = MO$3.0m ÷ (MO$322m - MO$130m) (Based on the trailing twelve months to June 2023).
Therefore, AB Builders Group has an ROCE of 1.6%. Ultimately, that's a low return and it under-performs the Construction industry average of 8.3%.
Check out our latest analysis for AB Builders Group
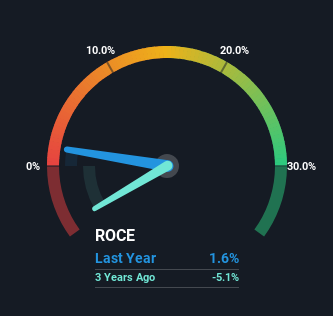
Historical performance is a great place to start when researching a stock so above you can see the gauge for AB Builders Group's ROCE against it's prior returns. If you want to delve into the historical earnings , check out these free graphs detailing revenue and cash flow performance of AB Builders Group.
What The Trend Of ROCE Can Tell Us
In terms of AB Builders Group's historical ROCE movements, the trend isn't fantastic. To be more specific, ROCE has fallen from 34% over the last five years. Given the business is employing more capital while revenue has slipped, this is a bit concerning. This could mean that the business is losing its competitive advantage or market share, because while more money is being put into ventures, it's actually producing a lower return - "less bang for their buck" per se.
On a separate but related note, it's important to know that AB Builders Group has a current liabilities to total assets ratio of 40%, which we'd consider pretty high. This can bring about some risks because the company is basically operating with a rather large reliance on its suppliers or other sorts of short-term creditors. While it's not necessarily a bad thing, it can be beneficial if this ratio is lower.
The Key Takeaway
We're a bit apprehensive about AB Builders Group because despite more capital being deployed in the business, returns on that capital and sales have both fallen. It should come as no surprise then that the stock has fallen 17% over the last five years, so it looks like investors are recognizing these changes. With underlying trends that aren't great in these areas, we'd consider looking elsewhere.
AB Builders Group does come with some risks though, we found 3 warning signs in our investment analysis, and 2 of those can't be ignored...
For those who like to invest in solid companies, check out this free list of companies with solid balance sheets and high returns on equity.
If you're looking to trade AB Builders Group, open an account with the lowest-cost platform trusted by professionals, Interactive Brokers.
With clients in over 200 countries and territories, and access to 160 markets, IBKR lets you trade stocks, options, futures, forex, bonds and funds from a single integrated account.
Enjoy no hidden fees, no account minimums, and FX conversion rates as low as 0.03%, far better than what most brokers offer.
Sponsored ContentNew: Manage All Your Stock Portfolios in One Place
We've created the ultimate portfolio companion for stock investors, and it's free.
• Connect an unlimited number of Portfolios and see your total in one currency
• Be alerted to new Warning Signs or Risks via email or mobile
• Track the Fair Value of your stocks
Have feedback on this article? Concerned about the content? Get in touch with us directly. Alternatively, email editorial-team (at) simplywallst.com.
This article by Simply Wall St is general in nature. We provide commentary based on historical data and analyst forecasts only using an unbiased methodology and our articles are not intended to be financial advice. It does not constitute a recommendation to buy or sell any stock, and does not take account of your objectives, or your financial situation. We aim to bring you long-term focused analysis driven by fundamental data. Note that our analysis may not factor in the latest price-sensitive company announcements or qualitative material. Simply Wall St has no position in any stocks mentioned.
About SEHK:1615
AB Builders Group
An investment holding company, engages in the provision of construction services in Macau, the People’s Republic of China, and Hong Kong.
Mediocre balance sheet with questionable track record.
Market Insights

Community Narratives

